Sales Forecasting Methods: How to Forecast Better

Sales forecasting methods range from simple projections based on last year’s numbers to statistical models that weigh dozens of variables. The right choice depends on how much clean data you have, how long your sales cycle is and how steady your market tends to be.
For distributors and CPG brands, a good forecast drives more than a revenue target. It shapes purchasing, production, staffing and how much inventory sits in the warehouse. This guide compares the most common sales forecasting methods, explains when each one fits and covers how to make any forecast more accurate. If you’re ready to move off spreadsheets, our overview of sales forecasting software is a good next step.
What is sales forecasting?
Sales forecasting is estimating future sales over a set period, such as a month, quarter or year. Forecasts can be built for the whole company, a territory, a customer or a single SKU. The more detailed the forecast, the more useful it is for planning inventory and routes.
The main sales forecasting methods
Historical forecasting
Uses past sales for the same period and adjusts for expected growth. If you sold $500,000 last March and expect 8% growth, you forecast $540,000 this March.
Best for: Stable businesses with several years of consistent data.
Weakness: Misses changes like new competitors, lost accounts or a new product line.
Moving average
Averages sales over a recent window, such as the last three or six months, and uses it as the next period’s forecast. It smooths out one-off spikes.
Best for: Products with steady demand and short planning horizons.
Weakness: Lags behind real trends and handles seasonality poorly.
Time series and seasonal models
Statistical methods that separate trend, seasonality and noise. Exponential smoothing and similar models give more weight to recent data while still capturing seasonal patterns.
Best for: Distributors and brands with strong seasonal swings, like beverages in summer.
Weakness: Needs clean data and someone comfortable with the models.
Pipeline or opportunity stage forecasting
Assigns a probability to each open deal based on its stage and adds up the weighted values. A $20,000 deal at a stage that historically closes 50% of the time counts as $10,000.
Best for: B2B teams with defined deal stages, like new retail account sales.
Weakness: Only as good as reps’ discipline in updating deals. See our guide to sales pipeline stages.
Rep or bottom-up forecasting
Each rep forecasts their own accounts and territories, and the numbers roll up.
Best for: Field teams where reps know account plans, promotions and store changes.
Weakness: Reps tend to be optimistic or sandbag. Compare their forecasts with actual results over time.
Regression and multivariable models
Link sales to drivers like price, promotions, number of stores carrying the product, weather or economic indicators.
Best for: Brands that want to understand what moves sales as well as predict it.
Weakness: Requires more data and analysis skill.
AI and machine learning forecasting
Models that learn patterns from large data sets and update as new data comes in. They can combine sales history, seasonality, promotions and external signals. Our guide to AI sales forecasting covers this approach.
Best for: Companies with lots of SKUs, accounts and clean history.
Weakness: Less transparent, and poor data leads to confident but wrong forecasts.
Comparing sales forecasting methods
| Method | Data needed | Effort | Handles seasonality |
|---|---|---|---|
| Historical | Past sales | Low | Partly |
| Moving average | Recent sales | Low | Poorly |
| Time series | Several years of sales | Medium | Well |
| Pipeline | CRM deal data | Medium | No |
| Rep forecasting | Rep input | Medium | Depends on reps |
| Regression | Sales plus drivers | High | Well |
| AI/ML | Large, clean data sets | High setup | Well |
How to choose the right method
Start with your data. If you have less than a year of reliable sales history, simple methods and rep input beat complex models.
Match the decision. Inventory planning needs SKU-level forecasts. Budgeting needs company or territory totals.
Combine methods. Many teams use a statistical forecast as the baseline and adjust it with rep knowledge about promotions, new accounts and lost stores.
Measure accuracy. Compare forecasts with actual sales every period and track the error. Keep the methods that perform best.
Making any forecast more accurate
Forecasts fail most often because of the data going in. Duplicate accounts, late orders and missing history all skew results. Clean sales data management is the foundation for every method above.
It also helps to forecast at the level you plan at. A distributor that buys by SKU should forecast by SKU and roll up, then feed those numbers into inventory forecasting and purchasing.
Forecasting from real field and order data
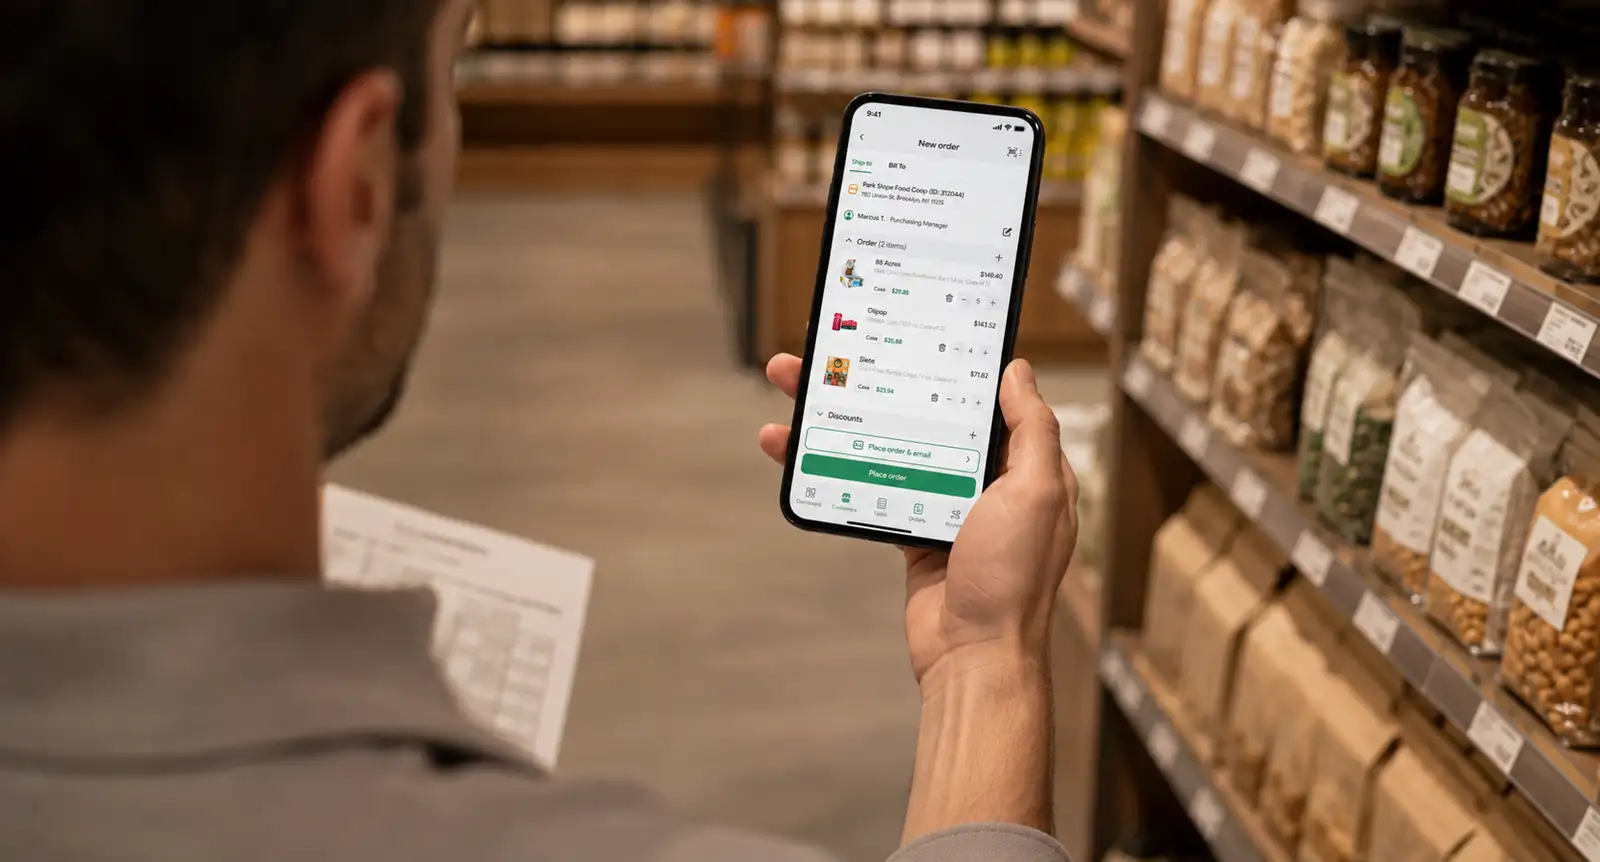
The best sales forecasting methods depend on timely, accurate data from every channel, including orders reps write in stores.
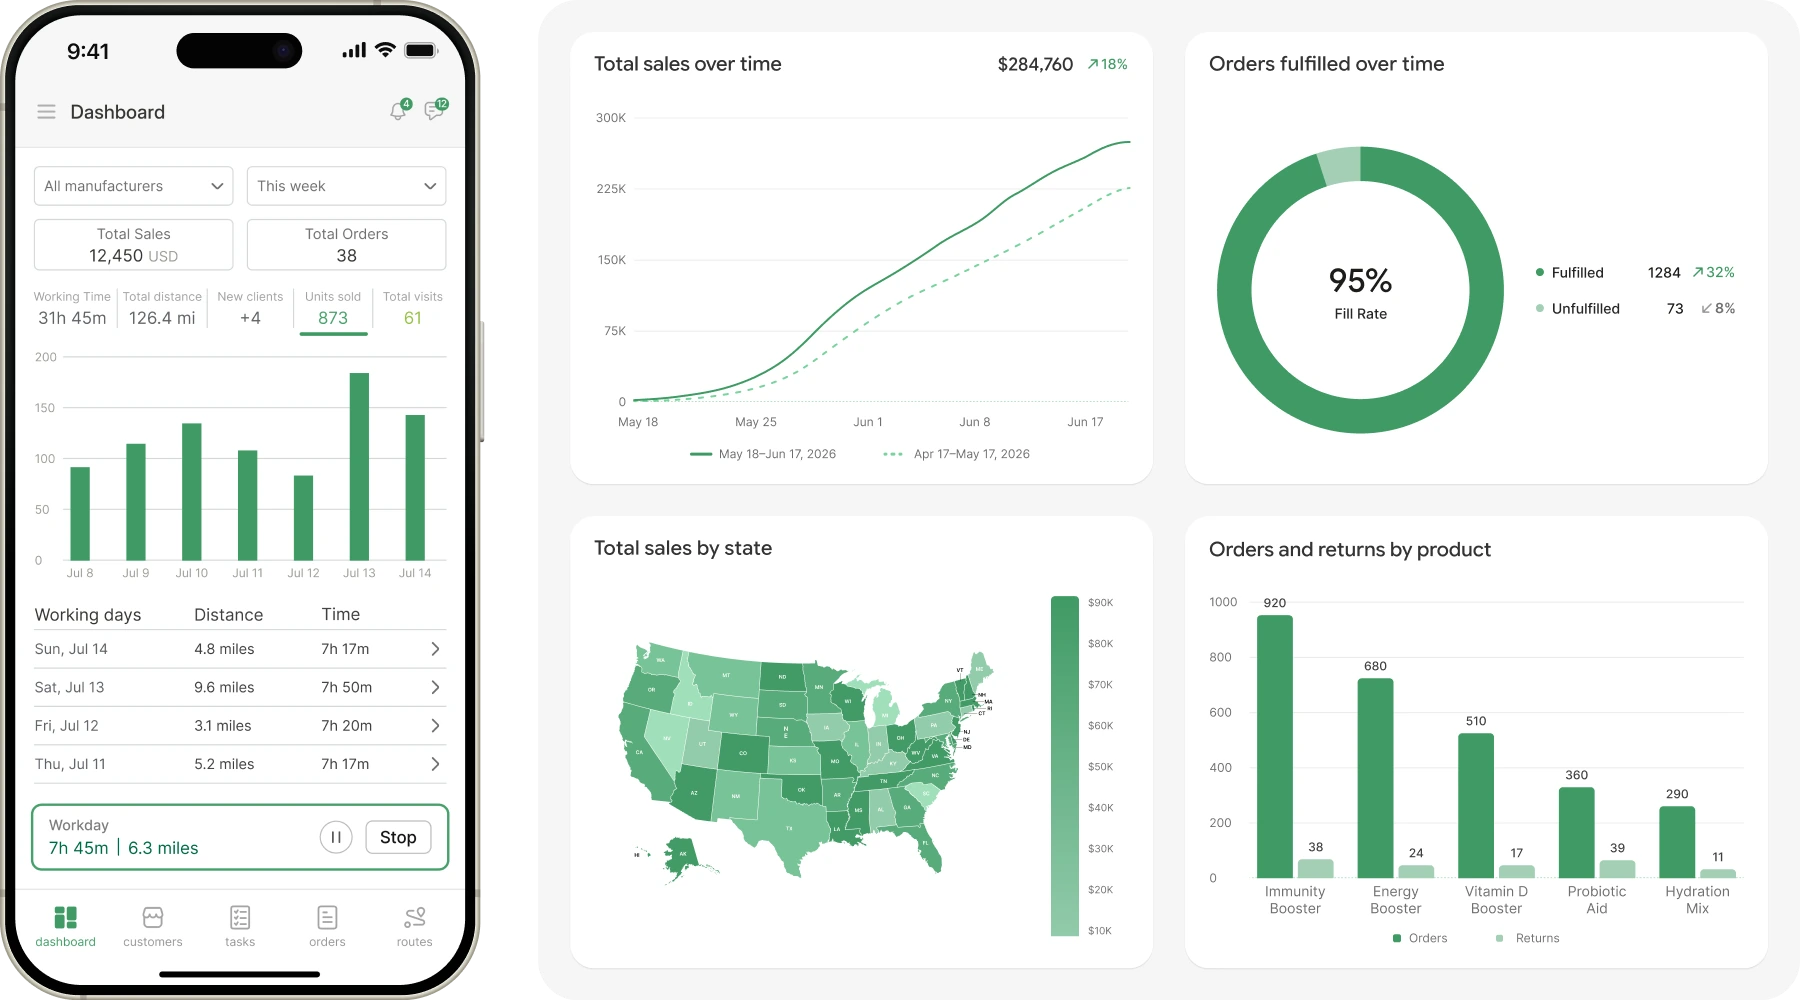
SimplyDepo captures orders, store visits and inventory in one platform, giving you clean sales history by account, territory and SKU to build forecasts on. Book a demo to see your data in one place.
Common methods include historical forecasting, moving averages, time series models, pipeline forecasting, rep forecasting, regression and AI-based forecasting.
It depends on your data and market. Time series and AI models are often most accurate with plenty of clean history, while simpler methods can perform better for new products or limited data.
Quantitative methods use numbers like past sales and statistical models. Qualitative methods rely on judgment from reps, managers or experts, which helps when data is limited.
Most distributors and CPG brands update forecasts monthly, with weekly reviews for fast-moving or seasonal products.
-
 February 27, 2026
-
 February 27, 2026
-
 December 6, 2025