SALES ANALYTICS SOFTWARE

Turn data into pipeline

Give every sales manager a live dashboard for rep, territory, and product performance. Track orders, activity, and forecasts across all accounts, with shared data for field reps and the back office.

Official partner
Book a demo
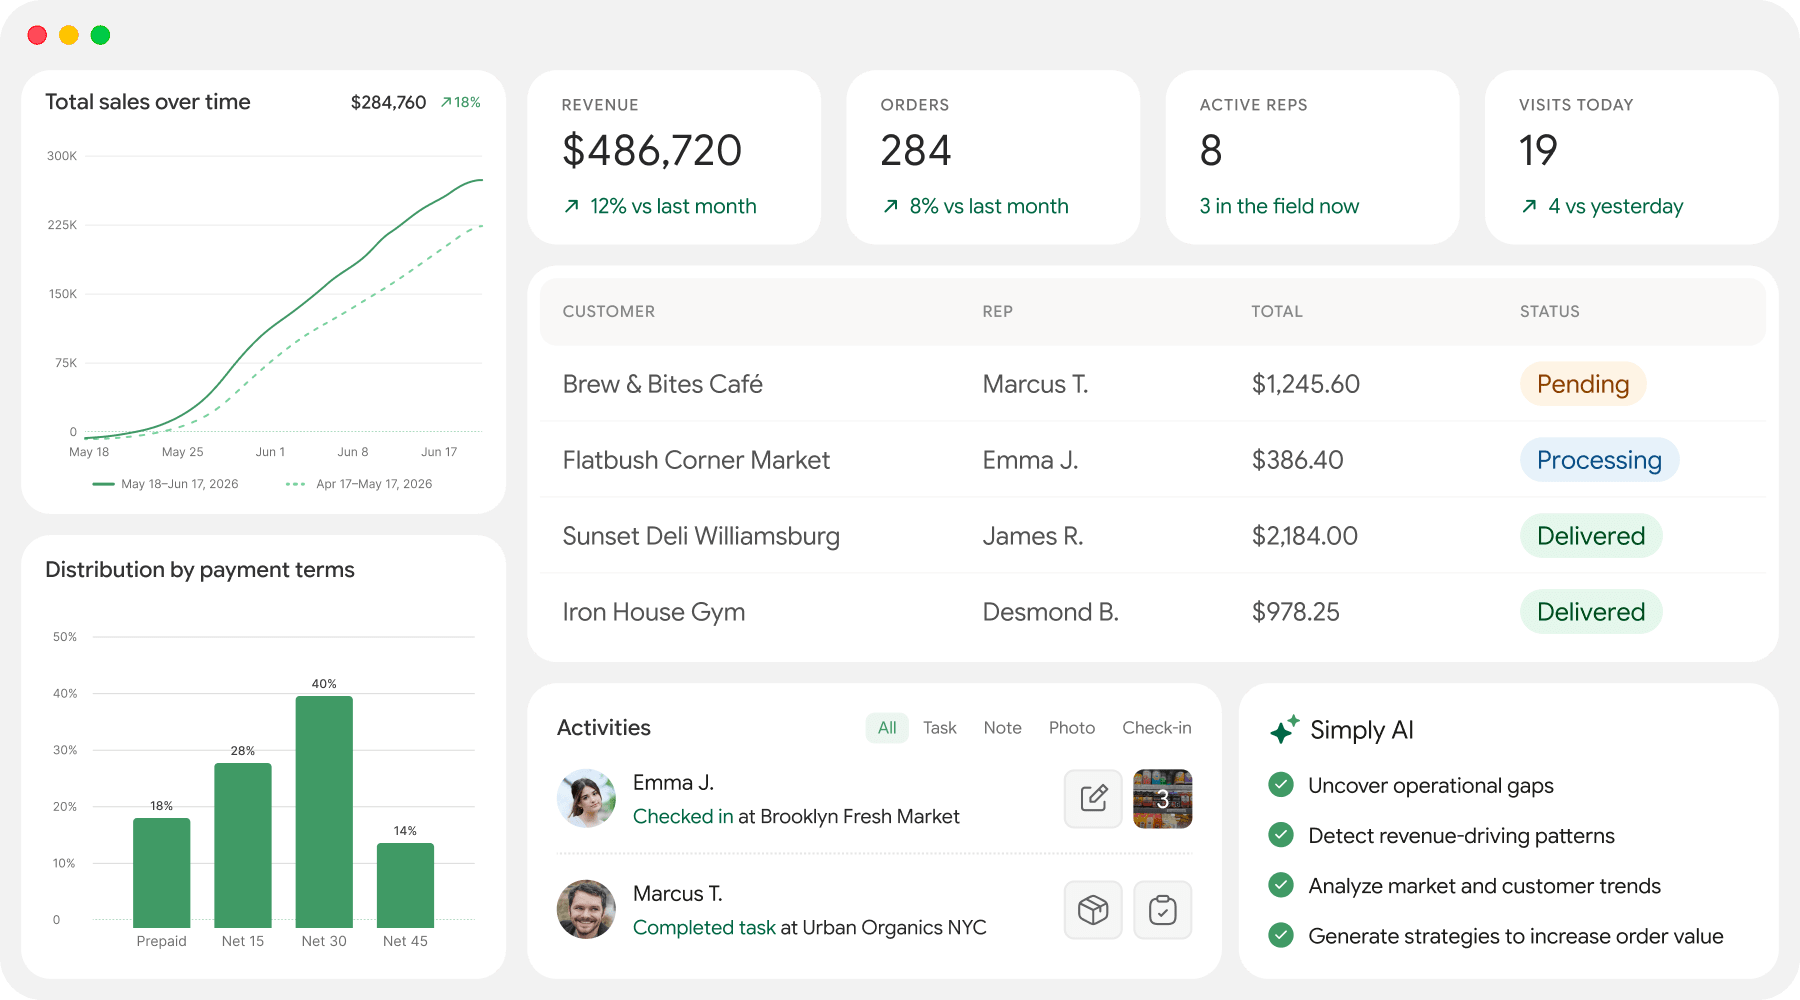
Sales analytics dashboard showing sales, payments, account activity, and orders

Trusted by top performing distribution teams

Gotham
Brickyard
Brooklyn Best
Tenace Distributing
Winneram
88 Acres

Sales analytics wired to live rep, order, and territory data

Every visit, order, and payment lands in the same data model. Custom dashboards, activity feeds, and SimplyAI Predictions all draw from that single source, so what reps see, managers see, and forecasts predict all match.

Analytics & Dashboards
Sales, payments, account map, and orders analytics panels

ANALYTICS & DASHBOARDS

Track rep, territory, and product performance

  • Custom dashboards per role

    Build reports per rep, product, or territory with drill-down filters saved to the team.

  • Real-time activity feed

    Field check-ins, orders, and photos flow into the dashboard the moment they happen.

  • SimplyAI Predictions

    Forecast next-month reordering by account using historical order and visit data.

Book a demo
Sales Rep App
Green Harbor new order on mobile with validated status

SALES REP APP

Capture visits, orders, and photos from the field in real time

  • GPS-verified check-ins

    Time and location stamped at every stop, feeding rep-performance dashboards directly.

  • Camera-only photo capture

    Photos submitted at the visit, attached to per-account forms and saved to the customer profile.

  • Order placement in the field

    Reps place orders from the account page with pricing and promotions applied automatically.

Book a demo
Order Management
Orders management dashboard

ORDER MANAGEMENT

Turn every account, order, and payment into useful data

  • Multi-channel intake

    Field reps, the B2B portal, email, and phone all feed the same order pipeline.

  • Per-customer pricing

    Each account gets its own price list, applied automatically at checkout.

  • QuickBooks Online sync

    Approved orders and payments post to your books, keeping every analytics number accurate.

Book a demo

How distribution teams use SimplyDepo for sales analytics

1

Import your data

Bring customers, products, pricing, territories, and rep list from your accounting tool or spreadsheets, and we handle the migration.

2

Build your dashboards

Configure reports per rep, product, and territory. Choose which metrics roll up and which teammates see them.

3

Track and report

See visits, orders, and payments on the dashboard in real time. Filter by rep, territory, or product to act the same day.

Track every rep, territory, and dollar in a live dashboard

Book a 20 minute demo. See how CPG and distribution teams turn field activity, orders, and forecasts into decisions from one connected app.

30-day free trial
No contracts
Free team training
Book a demo
SimplyDepo awards

Real results from distribution teams

Distribution operators use SimplyDepo to turn rep activity, order history, and payment data into decisions the same day.

  • From day one, every store visit, task and photo was captured in one place. It has become essential for managing retail execution day to day.

    Smiling bearded man with short hair in a blue shirt stands against a vibrant yellow background, ideal for featured front page images.

    Darien Brown

    National Retail Manager, 88 Acres

    Read case study
    • +10 hrs

      Saved weekly per sales rep

    • +30%

      Increase in reordering volume

    88 Acres snacks—Dark Chocolate Sunflower Seed Butter, Cinnamon Maple, and Dark Chocolate Sea Salt Bars—on a yellow backdrop.
  • With SimplyDepo, manual reporting and QuickBooks reconciliation disappeared. Reporting is now 3x faster and order accuracy climbed to 95%+

    Smiling man with short, light reddish-blond hair in a gray collared shirt stands before a beige background, representing Field Sales Software.

    Trent Moffat

    Founder at Gotham DSD

    Read case study
    • 3X

      Order accuracy improvement

    • 95%

      Increase in reordering volume

    A cheerful delivery worker with glasses and a cap holds a tablet and package, while another moves boxes. GOTHAM DIRECT STORE DELIVERY text appears.
  • With SimplyDepo, manual reconciliation disappeared. Orders now process three times faster and order accuracy exceeds 95 percent.

    Smiling woman with straight, shoulder-length brown hair in a reddish-brown top, foregrounded with others blurred behind her.

    Laura Mendez

    Operational Manager

    Read case study
    • 3X

      Faster order processing

    • 70%

      Reduction in order corrections

    A fully stocked supermarket aisle with blurred shelves, featuring the Tenace Distributing logo and two playing cards (10, Ace of clubs).
  • With SimplyDepo, the team saved 40+ hours weekly across reps and achieved 120% more efficient routes.

    Happy man with short, dark hair in a light green jacket stands smiling against a solid green background, radiating positive energy.

    Tim Sher

    Vice President, HC Foods

    Read case study
    • 3X

      Faster order processing

    • 70%

      Reduction in order corrections

    Centered against a blurred grocery store aisle, the HC Foods logo stands out in blue and red amid shelves of assorted products.
    INTEGRATIONS

    Connect your analytics and data stack

    Sync orders, payments, and inventory across QuickBooks Online, Stripe, ShipStation, and Shopify so every dashboard pulls from the same source of truth. Open API and Zapier bridge SimplyDepo to Tableau, Power BI, or any BI tool your team already trusts.

    Explore Integrations
    The Intuit QuickBooks logo features a green circle with the white lowercase letters “qb” inside, positioned next to the black text “INTUIT quickbooks.” This branding highlights QuickBooks as a reliable financial management solution for CPG sales platforms. The HubSpot logo displays the word "Hub" in dark blue and "Spot" in bright orange, with the letter "o" designed as an orange molecule-inspired graphic. This modern design embodies HubSpot’s innovative approach as a top CPG sales platform. The Zapier logo features the word "zapier" in bold, lowercase black letters, fronted by a sleek orange horizontal line. This modern design highlights seamless integration options, making it ideal for demonstrating connectivity on your CPG sales platform. The Zebra Technologies logo displays a distinctive, stylized zebra head on the left and the word "ZEBRA" in bold, uppercase letters to the right, symbolizing the brand's leadership and reliability in CPG sales platform solutions. The Acumatica logo displays a distinctive blue circular icon with a white center, positioned next to the word "Acumatica" in bold dark blue letters, symbolizing the brand’s authority and reliability as a leading CPG sales platform.
    Explore Integrations

    Your team's real-time analytics

    Sales analytics land fastest when the data source and the dashboard live under one roof. Distribution and CPG teams get a connected loop from field visit to reporting, ready the day onboarding completes.

    Feature
    Live dashboards for reps, territories, and products
    Real-time field activity feed
    AI-driven reorder predictions per account
    Native QuickBooks Online sync into analytics
    GPS-verified rep performance data
    Purpose-built for distribution and CPG teams
    Same app for capture, analysis, and action
    Open API for downstream BI tools
    Onboarding speed

    ✅ Yes
    ✅ Yes
    ✅ Yes
    ✅ Yes
    ✅ Yes
    ✅ Yes
    ✅ Yes
    ✅ Yes
    ✅ 3–5 business days
    Traditional Tools

    ⚠️ Limited
    ❌ No
    ❌ No
    ⚠️ Partial
    ❌ No
    ❌ No
    ❌ No
    ⚠️ Add-on required
    ⏳ Weeks – Months
    FAQ

    Frequently Asked Questions

    Have more questions? Contact us

    Sales analytics software turns field activity, order history, and customer data into reports that sales managers act on. For distribution and CPG teams, the strongest tools tie the analytics to territory, rep, and account context, so numbers connect back to who made them happen.
    Yes. SimplyDepo pairs a distribution-focused CRM (accounts, contacts, territories, license tracking) with live sales analytics on the same data. Every visit, order, and payment feeds both the account profile and the dashboard, so reps and managers see the same story.
    Yes. Per-account reorder forecasting uses each customer’s historical order cadence, visit history, and product mix, so predictions match your customers’ actual buying patterns.
    Yes. Rep performance dashboards track visits, orders, active accounts, hours logged, and territory coverage from GPS-verified check-ins. Managers see performance daily, and reps see their own numbers on mobile.
    Yes for the AI layer. SimplyAI Predictions drives the reorder forecasts, learning from your live order and visit data. The rest of the analytics stack (dashboards, filters, and reports) is rule-based and configurable. For complex machine-learning use cases (multi-variable price optimization, custom model training), teams bridge to a dedicated BI or ML platform through Open API.
    Tableau is a general-purpose BI platform built for flexible, custom reporting across any data source. Repsly Analytics is CPG-specific and covers retail execution reporting for merchandising teams. SimplyDepo bakes sales analytics into the same app that captures the data (orders, visits, photos, and payments), so distribution and CPG teams see live performance from one connected system. Teams already running Tableau typically keep it for enterprise reporting and use SimplyDepo for operational sales analytics.

    Schedule your demo

    Choose a convenient time to explore SimplyDepo with our team.