Why Profit Margins are Under Pressure in 2025
As we move into 2025, the distribution and wholesale landscape is being reshaped by rising costs all around. From fuel prices and global supply chain disruptions to labor shortages and fluctuating supplier rates, keeping healthy margins has never been more complicated. For ops and finance teams, knowing your numbers is no longer nice to have – it’s essential for sustainability, competitiveness and growth.
In short, businesses that know their numbers can act faster, make better decisions and navigate uncertainty with more confidence. Profit margins are not just financial metrics but strategic tools that influence pricing, purchasing, staffing and customer service decisions.
In an industry where margins are tight, a 1% improvement in profit margin can mean big bottom line impact. That’s why mastering margin calculations and knowing how to act on them is top priority for forward thinking distributors in 2025.
What is the Profit Margin Formula
What is Profit Margin?
Profit margin is a financial ratio that shows what percentage of revenue remains as profit after all costs are accounted for. It helps businesses measure how well they are earning relative to their sales. There are three types of profit margins:
- Gross Profit Margin: Measures the difference between revenue and cost of goods sold (COGS). It shows how well a business is producing or sourcing its products.
- Operating Profit Margin: Accounts for operating expenses such as wages, rent and utilities, shows the company’s ability to manage day to day operations.
- Net Profit Margin: The most comprehensive measure, takes into account all costs including taxes, interest and depreciation. Shows the final profitability of the business.
Profit Margin Formula
Here are the most used formulas:
- Gross Profit Margin = (Revenue – COGS) / Revenue
- Net Profit Margin = Net Income / Revenue
Example:
If a distributor makes €1,000,000 in revenue and has €700,000 in COGS, the gross profit margin would be:
(1,000,000 – 700,000) / 1,000,000 = 0.30 or 30%
That means for every euro earned, 30 cents is gross profit.
Another example using net profit:
If the same company has €100,000 in net income after all expenses, then the net profit margin would be: 100,000 / 1,000,000 = 0.10 or 10%
A 10% net margin means that for every euro in sales, 10 cents remain as net profit. Knowing and tracking both figures is key to balancing growth and efficiency.
How to Use the Profit Margin Formula in Wholesale & Distribution
In the world of B2B distribution, where pricing, logistics, and sales strategies vary by region and customer type, applying the profit margin formula with granularity is crucial.
Analyze Per-SKU Margins
Use the formula to calculate individual product profitability. This will help you see which products drive the most margin and which erode profits. Focus on high-margin SKUs in your sales strategy.
Evaluate Per-Route Margins
Distribution routes vary in cost based on geography, fuel consumption, and time. By calculating margin per route you can identify costly delivery paths and re-optimize them to improve efficiency.
Assess Per-Rep Margins
Sales reps work with different territories and customer types. Tracking their contribution to margin helps balance sales targets with profitability.
Segment Customer Profitability
Use margin calculations to see how different customer segments contribute to your bottom line. This will inform decisions on discounts, service levels, and contract renewals.
Key Takeaway: Profit margin isn’t a single company-wide metric. It needs to be applied at multiple operational levels to uncover optimization opportunities.
Gross vs Net Profit Margin: Which One Matters More in 2025?
In 2025, profit margins are under pressure from every direction—rising costs, tighter competition, and increased customer demands. Understanding both gross and net profit margins is essential for distributors who want to stay profitable and make informed decisions.
Gross profit margin focuses on the relationship between revenue and the direct cost of goods sold (COGS). It’s especially useful when analyzing product-level performance.
Use gross profit margin to:
- Measure how efficiently you’re sourcing or producing products
- Identify low-margin SKUs that weaken your bottom line
- Set pricing strategies and plan product promotions
- Negotiate smarter with suppliers
Net profit margin gives a broader view of your business’s financial health. It includes all expenses—operating costs, taxes, interest, and depreciation—showing what’s truly left after everything is paid.
Use net profit margin to:
- Understand your actual profitability after all expenses
- Evaluate whether your business model is sustainable
- Adjust operating strategies to control overhead and improve efficiency
- Track how decisions across departments affect the overall bottom line
Which one matters more in 2025?
It depends on your goals. If you’re optimizing products, pricing, or sales mix, gross margin is key. If you’re focused on long-term growth, controlling costs, or evaluating the health of your entire operation, net margin should be your focus.
The most effective strategy is to monitor both. Distributors who apply margin analysis across SKUs, reps, routes, and customer segments gain the insight needed to protect profits in a volatile market.
Let me know if you’d like to follow this with a section on how SimplyDepo supports margin tracking in real time.
Using SimplyDepo to Improve Margins
SimplyDepo is a modern, mobile-first B2B distribution platform designed to simplify operations, increase visibility and boost profitability. Unlike rigid ERP systems, SimplyDepo offers real-time tools for dynamic distribution teams.
Features That Support Margin Optimization:
- Live Inventory and Sales Data: See which products are profitable in real time.
- Mobile Order Management: Reduce order entry errors and manual work that eats into margins.
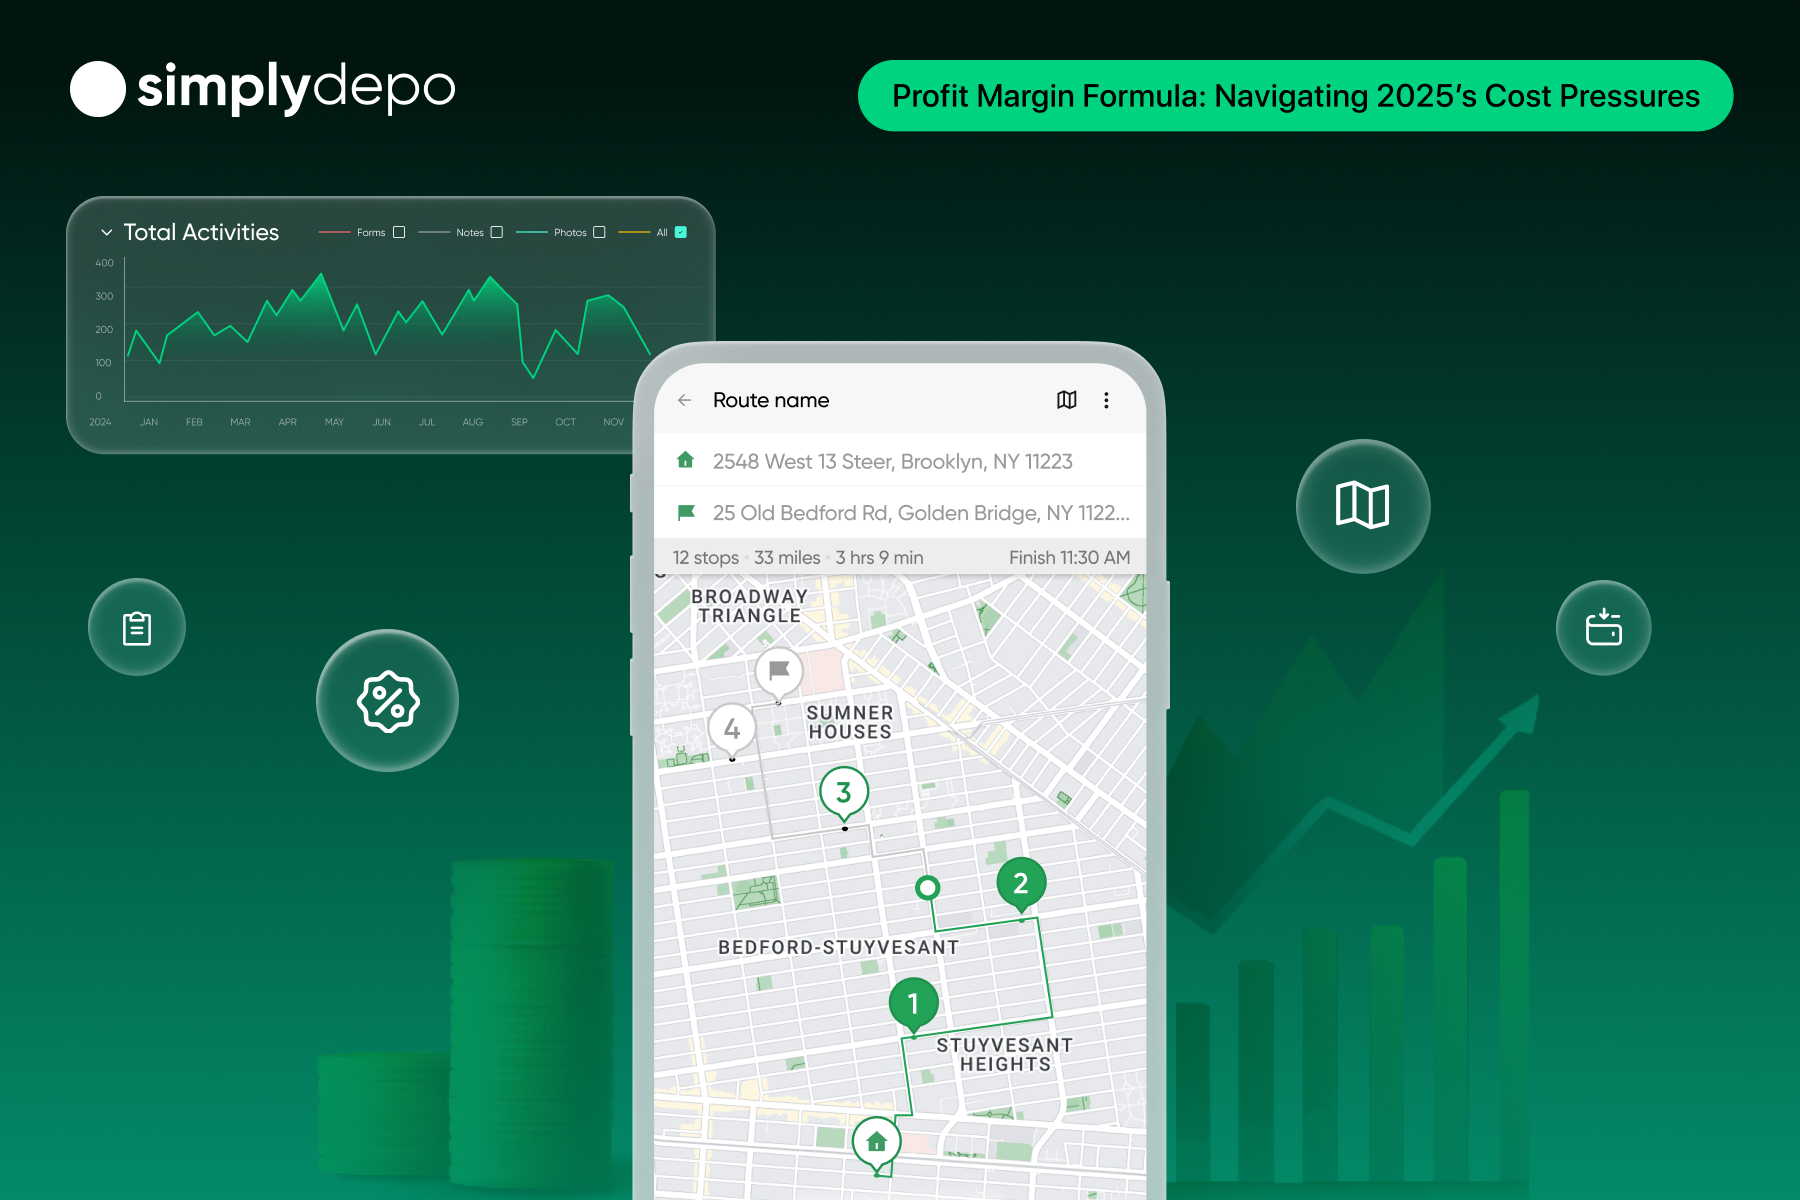
- Route Optimization: Automatically build more efficient routes that reduce fuel and labor costs.
- Field Sales App: Equip your sales team with data-driven insights to push high-margin products.
- Custom Pricing Tiers: Set margins by customer type, region, or sales channel.
SimplyDepo Use Cases:
- Margin by Product Category
A beverage distributor using SimplyDepo segments products into premium and standard categories. By analyzing margin trends, they phased out underperforming SKUs and saw a 15% gross margin improvement 2. Route Cost Reduction
A regional distributor reduced weekly fuel costs by 12% using SimplyDepo’s route optimization feature. Profit margin improved as a result of fewer kilometers driven and better order grouping. - Sales Rep Optimization
A wholesale food company used SimplyDepo’s sales rep dashboard to track individual rep performance and shifted resources to high margin accounts. They exceeded profit targets in Q1 2025. - Automated Inventory Replenishment
A consumer goods brand reduced dead stock and markdowns using SimplyDepo’s real-time inventory alerts and forecasting tools. This stabilized profit margins across multiple regions.
Ways to Protect Margins in 2025
Beyond formulas and software, businesses need to build resilience into their margin strategies.
- Cut underperforming SKUs: Remove low margin or low turnover products from your catalog.
- Negotiate better: Use purchasing data to get better terms from suppliers.
- Automate workflows: Reduce time and labor costs with digital tools.
- Optimize pricing: Adjust pricing tiers based on margin contribution.
- Leverage technology: Use platforms like SimplyDepo to unify your data and decision making.
- Refine delivery strategies: Minimize last mile costs through consolidated deliveries and better planning.
Looking for more? Read our related guides on inventory optimization, route planning, and reducing stockouts.
Conclusion
The profit margin formula is more than just a calculation. It’s a strategic compass in a year of uncertainty and rising costs. In 2025, distributors need to know their margins at every level – product to rep to route – to stay profitable and agile.
With SimplyDepo,, margin visibility and improvement is part of daily operations, not a quarterly report. Whether you’re optimizing routes, adjusting pricing, or empowering sales reps, SimplyDepo helps you turn insight into action.
Ready to improve your margins?
Book a demo with SimplyDepo to see how mobile-first inventory, sales, and routing tools can boost profitability across your entire distribution network.
Boost Sales.
Cut Manual Work.
Streamline ordering, routing, and retail execution — while giving every rep the tools to grow accounts faster.
-
+15h
Save weekly
per rep -
93%
Increase
buyer retention -
24%
Increase
in retail sales

Error: Contact form not found.


