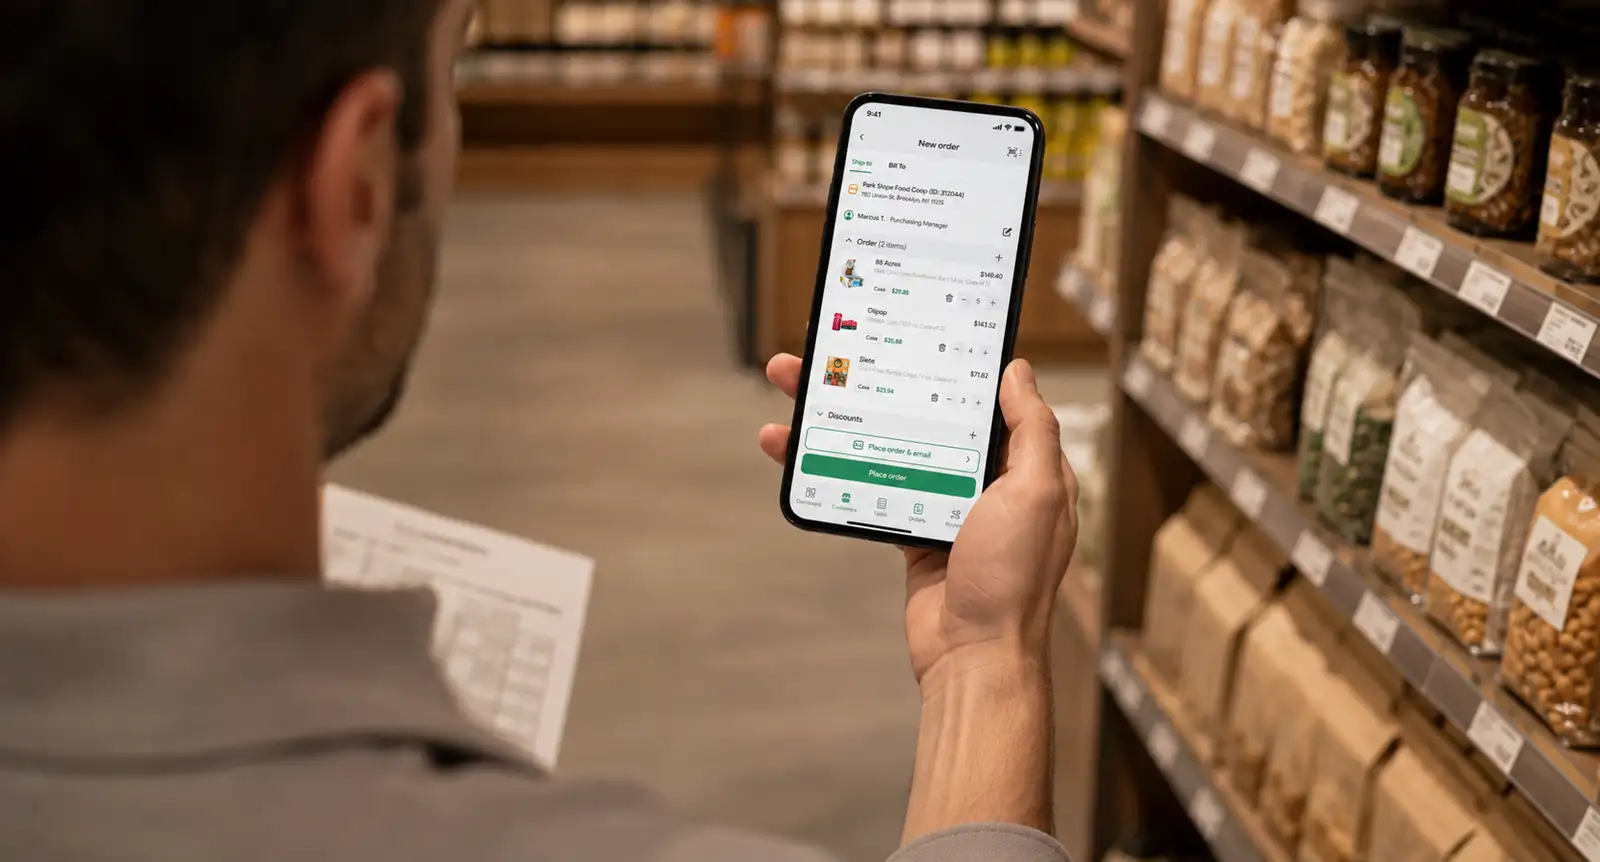
How to Increase Sales Efficiency for Field Teams and Distributors


Most advice about sales efficiency is written for software companies, where performance is often measured by comparing the revenue gained from new customers with the amount spent on sales and marketing. Those formulas and benchmarks are built around a software company’s cost structure, so they don’t always translate well to CPG brands and distributors.
A field team works under different constraints. Your reps drive between stores, wait for a receiver, count facings and write orders in a stockroom, and every one of those hours costs money whether an order comes out of it or not.
This guide covers how to increase sales efficiency when the selling happens in person. It defines the ratio in distributor terms, shows how to calculate it from your own books, and then works through the metrics and fixes that matter most.
What Sales Efficiency Means for a Field Team
Sales efficiency is the gross profit your team brings in for every dollar it costs to sell. A more efficient team gets more margin out of the same reps, cars and hours.
That makes it a different goal from sales effectiveness, which is the share of visits and pitches that end in a yes. The two can pull apart. A rep who visits every store weekly may win every reorder and still cost more than those accounts return, while a rep who spaces visits by account value may miss a few small orders and come out ahead.
For a distributor, gross profit is the right numerator, because revenue flatters thin margins. The Census Bureau’s wholesale survey puts 2022 gross margins for U.S. grocery merchant wholesalers (not counting manufacturers’ own sales branches) at 16.2% of sales, against 20.3% for merchant wholesalers across all of wholesale trade and 29.5% for beer, wine and spirits wholesalers.
At a 16.2% margin, a dollar of sales leaves about 16 cents to pay for everything, selling included. A CPG brand that sells direct to stores can run the same math with its own gross margin in place of a wholesaler’s.
How to Calculate a Sales Efficiency Ratio in Distributor Terms
A distributor’s sales efficiency ratio is the gross profit from the accounts your team sells to, divided by the fully loaded cost of selling to them, over the same period. A ratio of 3.0 means each dollar spent on selling returns three dollars of gross profit: one pays back the selling dollar, and two are left for the warehouse, the trucks, the office and profit.
Software companies use versions built on new recurring revenue, often lagged a quarter behind the spend. Those don’t fit a business that earns its money on repeat case orders, so build yours from two figures your accounting system already holds.
What Goes Into Fully Loaded Selling Cost
The denominator is the easy part to undercount. Wages and commission are the obvious line, and benefits are the line that’s easiest to leave out.
In June 2026, benefits made up 31.5% of employer compensation costs for full-time private industry workers, according to the Bureau of Labor Statistics. That’s $17.03 an hour of benefits against $36.97 of wages.
Read that figure carefully before you apply it. BLS counts paid leave as a benefit ($4.40 of the $17.03) and measures costs per hour worked, so if your wage figure is annual pay that already covers vacation and holidays, the remaining benefits add about 31 cents per wage dollar ($12.63 against $41.37).
On top of pay, add what it costs to put a rep in front of a buyer: vehicle and mileage, phones and software, samples and travel. Leave warehouse and delivery costs out unless the same person sells and delivers, as on many DSD routes. In that case, split the person’s cost between selling and delivery by hours worked.
A Worked Example
The table runs the numbers for an illustrative team of four reps at a grocery and CPG wholesaler. The wage, vehicle, software, sample and sales figures are placeholders to replace with your own, while the 31-cent benefits load and the 16.2% margin come from the two federal sources above.
| Line | How it’s calculated | Result |
|---|---|---|
| Wages and commission | 4 reps × $62,000 | $248,000 |
| Benefits | $248,000 × $0.31 per wage dollar | $76,880 |
| Vehicle and mileage | 4 reps × $9,000 | $36,000 |
| Phones and software | 4 reps × $3,000 | $12,000 |
| Samples | Team budget | $20,000 |
| Fully loaded selling cost | Sum of the five lines above | $392,880 |
| Gross profit | $9.6 million in sales × 16.2% | $1,555,200 |
| Gross profit per selling dollar | $1,555,200 ÷ $392,880 | 3.96 |
The same team’s revenue-based ratio would read 24.4 ($9.6 million divided by $392,880), which is why revenue ratios make distributors look remarkable and tell them very little.
The placeholder figures also pass a sanity check. Selling costs here come to 4.1% of sales. The same Census survey shows grocery merchant wholesalers spent 11.7% of sales on all operating expenses in 2022, so this team’s selling cost leaves room for the warehouse, the fleet and the office.
If you’d rather start from visits than from your cost ledger, SimplyDepo’s free field sales ROI calculator takes your rep count, extra visits per day, visit conversion rate and average order size, then estimates revenue growth, payback and weekly time saved.
The Sales and Marketing Efficiency Ratio
Add the money spent to create demand and you get the sales and marketing efficiency ratio: gross profit divided by selling cost plus marketing costs and trade spend, such as demo days, trade shows and sell sheets. In the example, an illustrative $120,000 of that spend raises the denominator to $512,880 and lowers the ratio from 3.96 to 3.03.
Use this version when reps and marketing dollars chase the same accounts, as when a brand pays for in-store demos its reps book. If promotional allowances or slotting fees come off your sales line, they’re already inside gross profit, so don’t count them a second time.
The benchmark ranges on software blogs assume software margins and software revenue, so neither ratio has a fair outside yardstick here. In SaaS, teams often compare a sales efficiency formula such as the magic number or net sales efficiency instead: gross sales efficiency looks only at net new ARR versus sales and marketing spend, while net sales efficiency adjusts for churn, and SaaS companies often target 0.75 to 1.0, with a magic number above 0.75 generally signaling efficient growth. Compare your own quarters, reps and territories instead.
Sales Efficiency Metrics That Show Where the Cost Goes
The ratio tells you whether selling pays, and sales efficiency metrics tell you where it doesn’t. These are the key metrics reps and managers should review daily, weekly, and monthly so the team has a clear productivity roadmap, and each efficiency metric is more useful when read alongside sales productivity rather than on its own.
| Metric | How to calculate it | What a weak number can point to |
|---|---|---|
| Selling cost per stop | Fully loaded selling cost ÷ completed visits | Too few stops per day, or too much cost per rep |
| Gross profit per stop | Gross profit ÷ completed visits | Visits going to accounts that order little |
| Stops per selling day | Completed visits ÷ days worked | Long drives, long waits or a loose route |
| In-store share of the day | Hours checked in at stores ÷ hours worked | Driving and admin crowding out selling |
| Order correction rate | Orders edited or credited after submission ÷ all orders | Price or pack-size errors at order entry |
| Reorder rate | Accounts reordering within their usual cycle ÷ active accounts | Visits that aren’t keeping shelves stocked |
| Cost to serve by tier | Selling cost assigned to a tier ÷ that tier’s gross profit | Small accounts getting big-account attention |
If the four reps in the worked example each work 230 selling days at 10 stops a day (two more placeholders), they make 9,200 visits a year. That puts selling cost at $42.70 a stop against $169.04 of gross profit per stop. Those two numbers explain the ratio to a rep better than a quarterly P&L does, because a rep controls stops directly.
Pipeline and win-rate measures still belong in the wider set of B2B sales KPIs a manager reviews. The seven above are the ones that change when you fix drive time, visit frequency or order entry.
Find Out Where Your Reps’ Hours Actually Go
Measure a normal week before you change anything. Estimates from memory tend to miss the small blocks that add up, such as waiting for a buyer to come off the floor or keying orders at the kitchen table. CRM and sales enablement tools can automate administrative work like data entry and other repetitive tasks while preserving relationship-building time in stores for revenue generating activities.
Here’s a one-week time audit you can run with the data you already have.
- Pick a week with no trade show, holiday or product launch in it.
- Pull check-in and check-out times for every visit, or ask reps to note them if you have no field app.
- Sort each rep’s day into driving, selling in the store, waiting, merchandising and admin.
- Record when each order was entered, since orders keyed after hours are admin time the day hides.
- Total the hours in each category for every rep and for the team.
- Circle the biggest non-selling blocks and choose one to fix first.
Timestamps beat self-reports because nobody has to remember anything. SimplyDepo’s GPS-verified check-in records the time and place a rep arrives, and its sales rep tracking shows each visit to the manager as it happens. Organized customer data in CRM reports also helps managers qualify and prioritize follow-up better in the field, and using CRM tools well can let sales teams handle far more leads. Most of the audit week then becomes a report you pull, and reps only need to note how their time in each store splits between waiting, selling and merchandising.
How to Increase Sales Efficiency by Cutting Drive Time
If you’re deciding how to increase sales efficiency on the road, look at drive time early. It’s the cost a field team carries and an inside team doesn’t, and it responds to planning more than to effort. Start by grouping each rep’s accounts into day clusters as part of a repeatable sales process, so a rep works one part of the territory per day instead of crossing it twice. That kind of sales optimization reduces friction and makes delays easier to spot.
Inside each cluster, set the order of stops around what the stores need, such as a receiving window before 10 a.m. or a buyer who only works afternoons. A rep who arrives while the receiving door is busy tends to wait or come back, and both show up as lost selling time.
The payoff is easy to put in numbers. If tighter clusters add one stop a day for each of the four reps in the example, the same $392,880 now covers 10,120 visits a year, and selling cost per stop falls from $42.70 to $38.82. The ratio itself only rises if those 920 extra visits bring in gross profit, or if the time saved cuts overtime or mileage.
Treat the cluster as the unit you plan, and the route as something you rebuild when a store opens, closes or changes its hours. That planning discipline helps improve efficiency by making the work more consistent.
Set Visit Frequency by Gross Profit, Not Habit
Visit frequency should follow what an account returns and how fast its shelf moves. Visiting every store on the same schedule gives the smallest accounts the same hours as the largest.
The arithmetic from the example makes the point. At $42.70 a stop, a weekly visit costs about $2,220 a year, and a visit every four weeks costs about $555. An account that produces $1,800 of gross profit a year loses money on weekly visits before delivery is counted, and covers its visits on a four-week cycle with money left for delivery. The saving only turns into profit if the freed hours go to accounts that return more.
Tier accounts on gross profit worked out the same way for every account, using one profit margin formula, or the tiers will reflect pricing quirks rather than value. Tie those tiers to your Ideal Customer Profile so reps focus resources on high-potential leads, improve lead qualification, and support better customer acquisition economics. Then give each tier a default rhythm, such as weekly for the top tier, every two weeks for the middle and every four weeks for the rest, with reorders in between by phone or a self-service ordering portal.
Even simple account scoring based on account traits and reorder behavior can help align sales on qualification and prioritization. Make exceptions on purpose. Short-dated products like dairy, bread and fresh juice may need frequent visits at any account size, and a small store that just took your product on may need extra visits until it reorders on its own.
Take Order Entry Out of the Evening
Orders written at the shelf, on a phone, with the account’s own prices already loaded, remove the evening re-keying so sales reps can spend more time on high-value selling activities. Every order typed twice is two chances to get a price or a pack size wrong, so cutting that repeat work helps boost efficiency.
A correction costs more than the minutes to fix it. It can mean a credit memo, a second delivery, a call from an annoyed buyer and a rep who spends part of the next visit apologizing instead of selling.
SimplyDepo’s mobile app writes each order against that account’s price list and keeps working in a stockroom with no signal, uploading once the phone reconnects. Like CRM and sales automation platforms used for sales enablement, it keeps account details current to reduce prep time and improve in-store customer conversations. Orders sync to QuickBooks Online when they ship (QuickBooks Desktop isn’t supported), and your accounting system stays the record for your books and tax, since SimplyDepo is a field sales platform and not an accounting system or an ERP.
Clean orders at the source also make the next step possible. Once orders arrive right the first time, the back office can move toward automated order processing, where approved orders flow to picking and invoicing without anyone keying them again.
Pay for Field Hours You Can Verify
If you pay people by the hour to work in stores, verified check-in and check-out turns those paid hours into auditable ones. Unverified hours are a cost the ratio sees and the manager can’t check.
Waku, a Brooklyn prebiotic iced tea brand, sells through more than 500 retail locations in six Northeast states with four full-time reps and 20 to 30 part-time brand ambassadors. Before moving to SimplyDepo, a field sales management platform for CPG brands and distributors, Waku tracked field activity in Excel and Google Forms and had trouble verifying how long ambassadors actually spent in stores, which risked paying for hours nobody worked.
Once check-ins were location-checked and every visit needed a report, overpaid field hours fell by 30%, according to the Waku case study. Every brand rep check-in is now verified, and reporting and payroll are processed twice as fast. Its rule since then is simple: a visit that isn’t checked in and reported didn’t happen.
The same logic applies to hourly merchandisers and to reps on mileage reimbursement. Paying against check-in records rather than self-reported timesheets trims the denominator without touching anyone’s selling time.
How to Increase Sales Team Performance From Activity Data
If you’re working out how to increase sales team performance without adding people, coach the activities that move your metrics, one at a time, and compare reps only against others working similar routes; coaching works better when reps have clear sales targets tied to route realities. A rural rep with long drives between stops shouldn’t be measured against a rep who walks between delis.
Start by defining what a completed visit includes, such as a shelf check, a photo, a conversation with the buyer and an order or a recorded reason for no order. Reps can’t hit a standard nobody wrote down, and a written one gives the ride-along something specific to check.
Pick one number per rep to improve each month. A rep with low stops per day needs help with clusters and timing, while a rep with plenty of stops and low gross profit per stop may need help selling a second product or a larger case count, or a route with fewer low-value accounts.
Run quick reviews of lost deals or no-order visits to surface objection-handling gaps and process issues, since continuous training and coaching help reps handle objections faster and high-performing teams do this to refine their sales strategies.
Pair reps for a day now and then, and send the one with weaker numbers to ride with the one whose route looks most like theirs. A monthly rhythm of review, coaching and follow-up is the practical core of sales performance management for a field team, and it keeps the conversation on activities a rep can change; the right sales model also shapes how those results should be judged. A sales leader should reinforce profitability and speed in coaching and incentives, so sales compensation structures reward those outcomes, not just activity volume.
Know When Efficiency Starts Costing Sales
Efficiency is a ratio, so you can raise it by cutting cost while gross profit quietly shrinks too. A common way this happens is a cut in visit frequency that leaves shelves empty between visits.
For the next two or three order cycles after you change an account’s frequency, watch its reorder rate, its order size and any out-of-stocks or lost facings the rep records. If those slip, move the account back to its old rhythm and try a different fix, such as a phone reorder between visits.
Watch the rep side as well. A rep pushed to add stops can start rushing visits, skipping the shelf check and writing smaller orders to keep moving.
You’ll catch both problems sooner if you can see what happened at each stop, which is the heart of field sales team management and the reason to review visit notes alongside the numbers.
A 90-Day Plan to Increase Sales Efficiency
A quarter is long enough to make a few changes and measure them against the quarter before, with the plan aimed at maximizing output from the same people, routes, and spend to boost sales efficiency.
- In weeks one and two, calculate the ratio for last quarter and for the same quarter a year earlier, run the time audit, and align sales and marketing teams on lead definitions, account handoff rules, and a simple SLA where both functions touch the same accounts to improve sales efficiency.
- In weeks three and four, tier accounts by gross profit, set a default visit frequency per tier, and start watching reorder rates on the accounts you moved.
- In weeks five and six, regroup each rep’s accounts into day clusters and rebuild the routes.
- In weeks seven and eight, move order entry into the store and track the correction rate weekly.
- In weeks nine through twelve, coach one activity per rep and watch reorder rates on accounts whose frequency changed.
- In week thirteen, recalculate the ratio and the per-stop metrics and compare them with where you started.
Comparing against the same quarter a year earlier, as well as the quarter just gone, keeps a seasonal swing from passing for progress or hiding it.
Make the Ratio a Monthly Number
The simplest habit for anyone asking how to increase sales efficiency is to make it a number the team sees every month rather than once a year, because tracking sales efficiency helps the team spot whether changes are paying back faster, including how quickly selling costs are recovered. Put the ratio, selling cost per stop and gross profit per stop on the monthly review, and show each rep their own lines next to the team’s. Use the same review to calculate sales efficiency consistently, and to measure sales efficiency against the previous month so weak spots are easier to catch.
Keeping those numbers current depends on recording visits and orders without creating extra work for the rep. Field sales management software can help by capturing that activity as reps move through their routes. With SimplyDepo, for example, CPG brands and distributors can keep visit and order records updated from the rep’s phone, while margins and costs remain in their accounting system. If you’d like to see how this could work across your routes, you can book a demo.
Frequently Asked Questions
Sales efficiency is how much a sales team returns for each dollar it costs to run. For a distributor or a field team, the useful version divides gross profit by fully loaded selling cost, which includes wages, benefits, vehicles, phones, software and samples. It’s different from sales effectiveness, which measures how often visits and pitches end in a yes.
Take the gross profit earned on the accounts your reps cover and divide it by everything it costs to sell to them in the same months, benefits, vehicles and samples included. In this guide’s illustrative example, four reps cost $392,880 a year and bring in $1,555,200 of gross profit on $9.6 million of sales, a ratio of 3.96. Software companies use recurring-revenue versions that don’t transfer to wholesale.
There isn’t a reliable outside benchmark for the gross-profit version, and the ranges on software blogs assume software margins. Grocery merchant wholesalers kept 16.2% of sales as gross margin in 2022, per the Census Bureau, so a revenue-based ratio reads about six times the gross-profit version (24.4 against 3.96 in this guide’s example). Track your own ratio by quarter, rep and territory, and treat a steady rise with stable reorder rates as the goal.
It’s the same gross-profit ratio with marketing and trade spend added to the cost side, such as in-store demos, trade show booths and printed sales material. Use it when reps and marketing dollars work the same accounts. Leave out allowances and slotting fees that already come off your sales line, since those are counted in gross profit.
If you want to know how to increase sales team performance with the people you already have, start by coaching one activity per rep at a time, based on data from their visits. Define what a completed visit includes, compare reps against others with similar routes, and pair weaker reps with stronger ones for ride-alongs. Look for gains in stops per day, order corrections and visit frequency before asking anyone to work longer hours.
-
 October 1, 2026
-
 October 1, 2026
-
 October 1, 2026