What Is a Planogram? How to Build One That Sells (2026)

📌 Key takeaways:
- A planogram is a visual merchandising blueprint that defines exactly where products should be placed on retail shelves, including shelf position, facings, spacing, and product sequence.
- Strong planograms improve shelf visibility, reduce out-of-stocks, support faster replenishment, and increase sales per linear foot.
- Different retail channels require different planogram strategies. Grocery, convenience, pharmacy, and beauty stores each prioritize shelf space differently.
- The best planograms combine sales data, fixture dimensions, shopper behavior, and replenishment realities instead of relying on visual instinct alone.
- Retail execution tools like SimplyDepo help field reps verify shelf compliance with mobile audits, geo-tagged shelf photos, and execution dashboards.
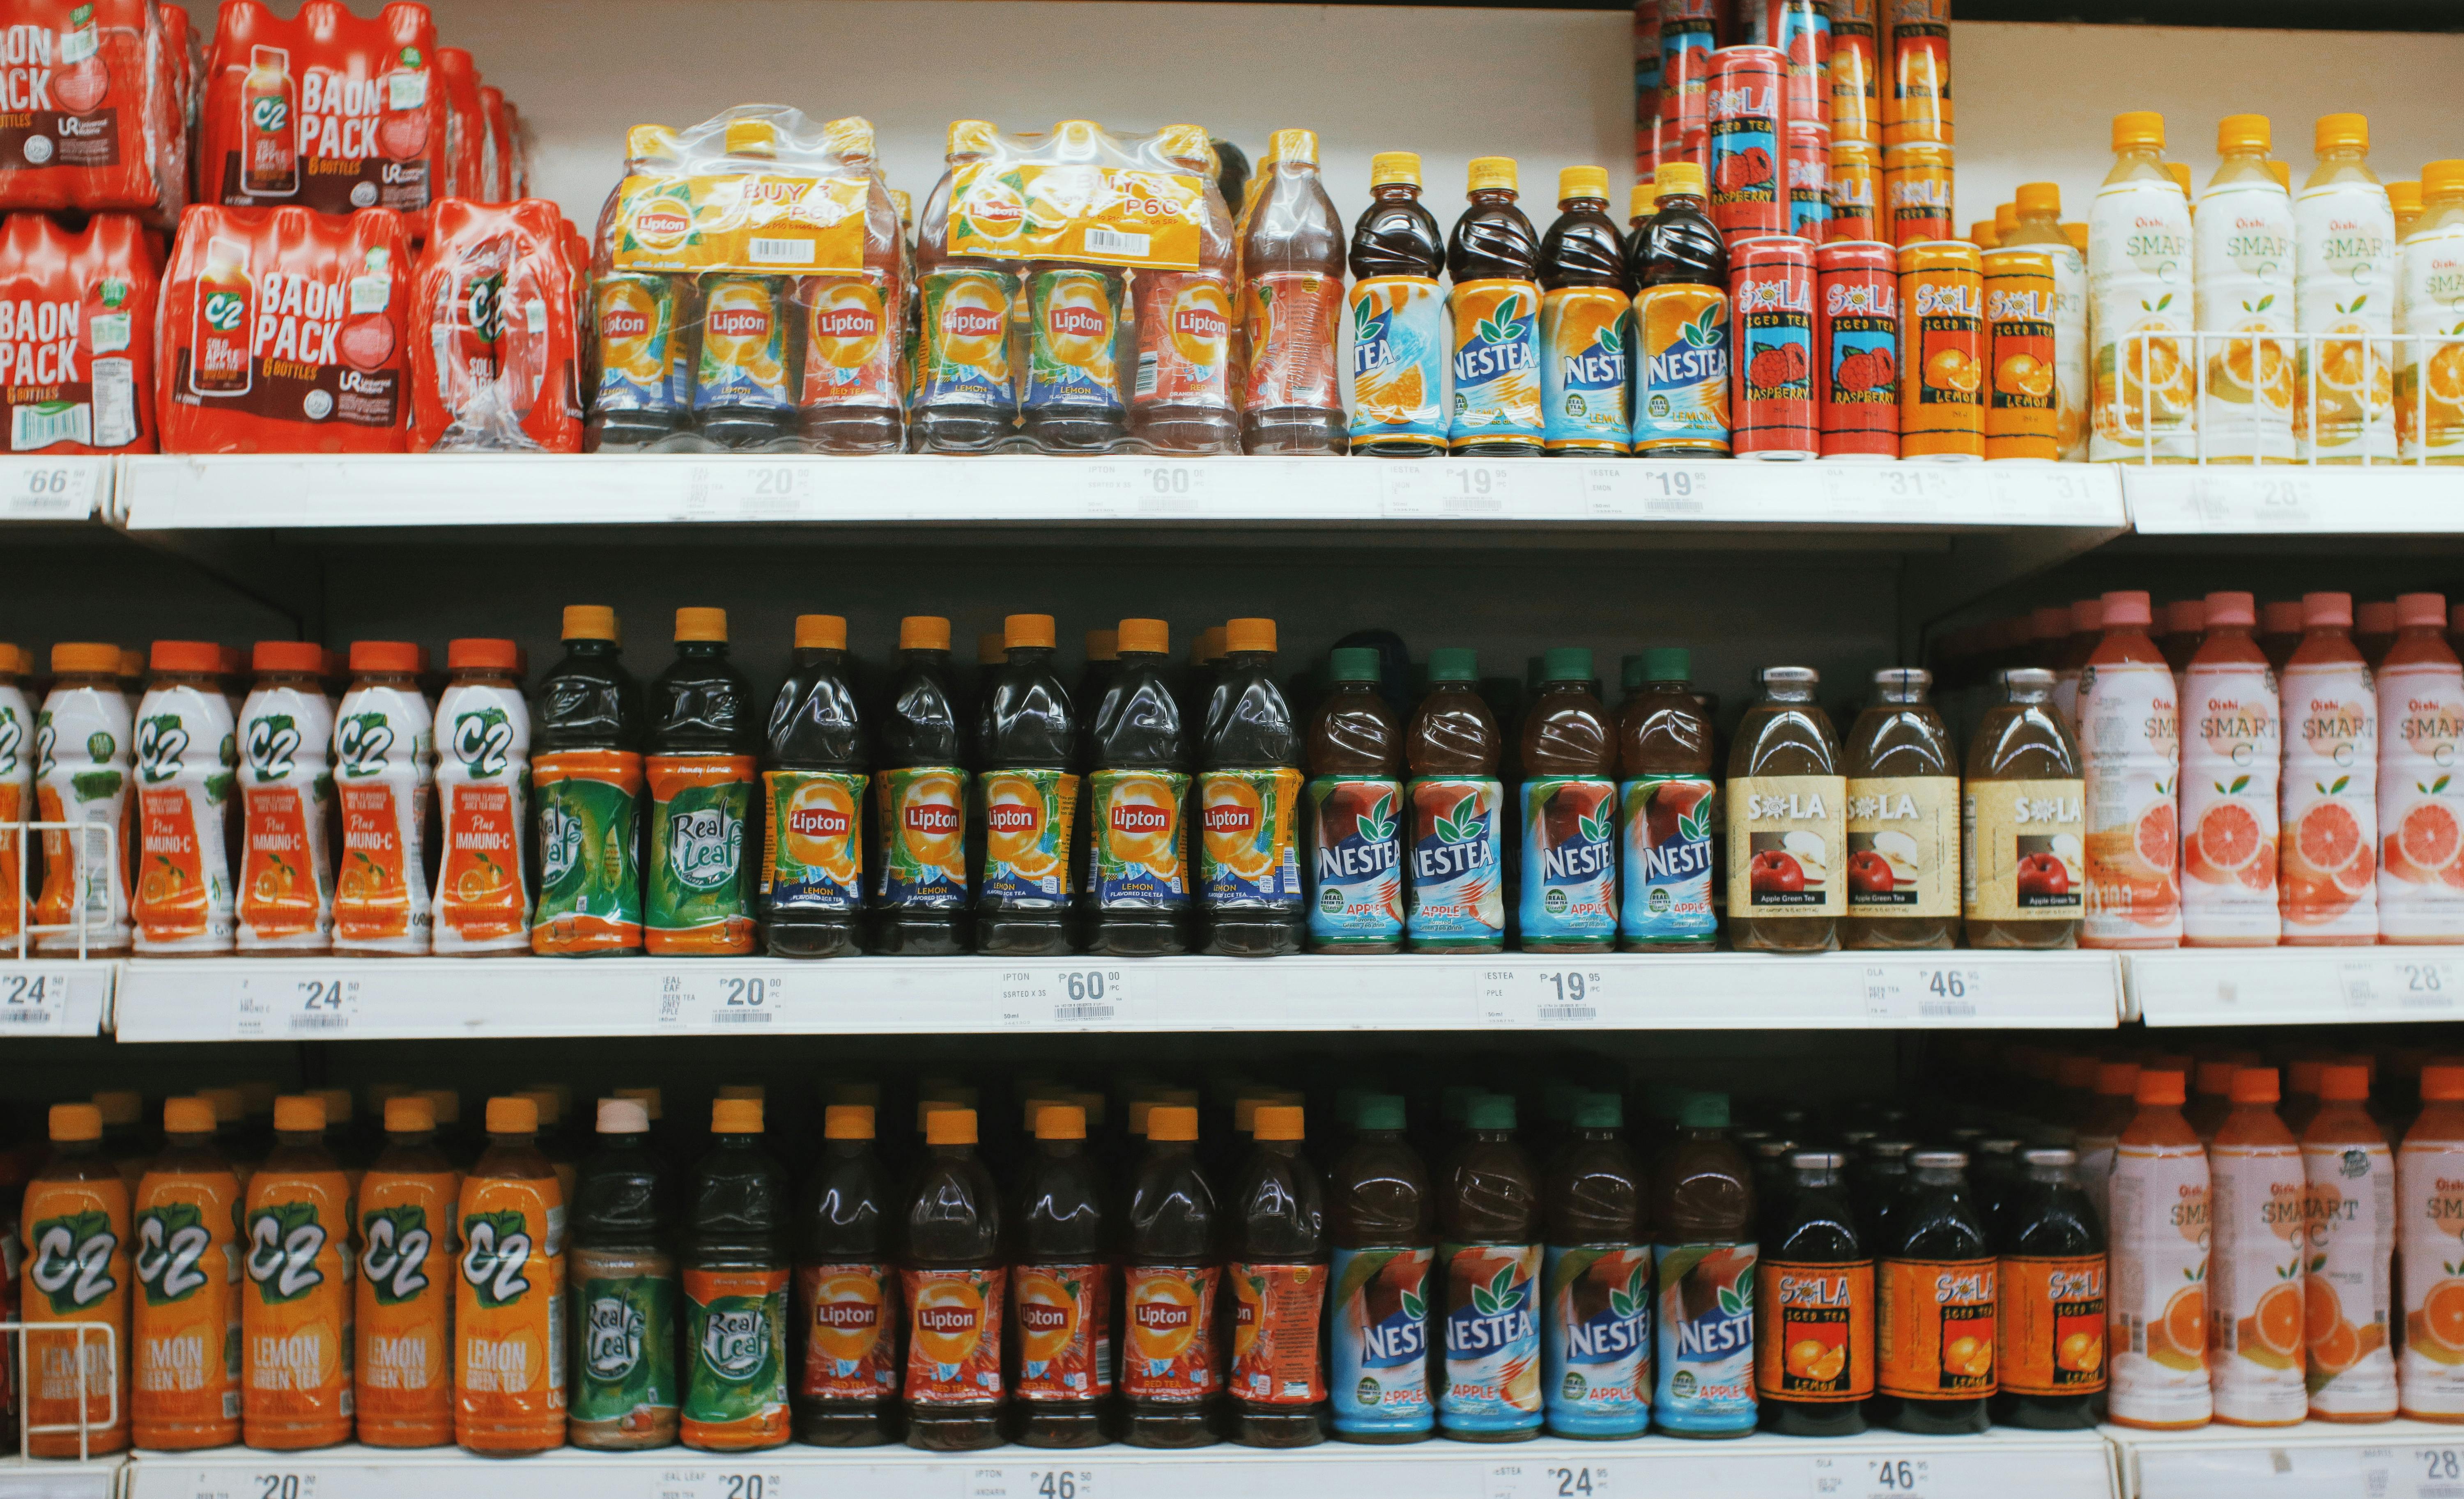
A shopper walks into a convenience store looking for an energy drink. They glance at the cooler for three seconds, grab the brand sitting directly at eye level, and head to checkout. The product beside it, placed too low and partially hidden, never even gets noticed.
That tiny shelf decision is what planograms are built around.
A planogram defines where products should be placed and how much shelf space they receive. When done well, it improves product visibility, reduces out-of-stock situations, and helps retailers drive more sales from the same shelf space.
In this guide, we’ll discuss what planograms are, the different types used in retail, how to build one, and the best practices behind effective shelf execution.
What is a planogram and what does it do?
A planogram is a detailed visual representation that defines exactly how retail products should be arranged on a fixture.
Also called a POG or shelf plan (you’ll sometimes hear ‘space plan’ as well), it goes well beyond a simple sketch of a shelf.
The key features of a complete planogram are:
- Product facings: How many units of each SKU face the customer
- Shelf positioning: Which shelf, and the left-to-right sequence
- Product dimensions: Width and height plus depth to confirm physical fit
- SKU data: UPCs, product descriptions, unit of measure
- Fixture specs: Shelf heights and depths, peg configurations, cooler requirements
- Visual instructions: Product orientation and stacking rules, including label direction
Planograms range from hand-drawn store layouts for a single display to complex software-generated models covering an entire store floor.
They sit at the center of visual merchandising, translating high-level category strategy into actionable instructions that a merchandiser or planogram specialist can execute on-shelf.
Every missing element in the spec creates a decision point for the field team. A planogram without product dimensions forces improvised spacing. One without a SKU list invites substitutions.
Each detail left out moves the shelf further from the plan, and further from its sales potential.
What are the different types of planograms?
Not every planogram serves the same purpose. They split into two broad categories: format-based types that define the store layout and structure, and strategy-based types that define the logic behind optimal product placement.
| Type | Category | Purpose | Best for |
|---|---|---|---|
| Shelf planogram (image POG) | Format | Defines product arrangement on standard gondola shelving: facings and spacing, shelf heights, category blocking | Category managers building everyday shelf layouts |
| Floor plan planogram | Format | Bird’s-eye view of the entire store: departments and aisles, fixtures, customer flow | New store design or major store resets |
| Schematic planogram | Format | Simplified visual layout with key positions highlighted for quick field execution | Store teams implementing resets without detailed software |
| Space optimization planogram | Strategy | Allocates shelf space based on sales velocity and margin contribution through space allocation rules | Maximizing revenue per linear foot of shelf |
| Market share planogram | Strategy | Assigns shelf share proportional to a brand’s market share in the category | Category reviews and vendor negotiations |
| Profitability planogram | Strategy | Prioritizes high-margin products in prime positions regardless of volume | Retailers or brands optimizing for profit over revenue |
The format defines how the planogram looks. On the other hand, the strategy defines how products earn their place on the shelf.
In practice, a single planogram often combines both: a shelf POG built using a space optimization strategy, for example.
Which approach you choose depends on the product categories you manage and whether you need to highlight a particular product (such as a new launch) or optimize an entire section for higher sales.
Understanding these distinctions is key when you’re choosing the right retail merchandising strategies for your category and retail environments.
Planogram examples by retail channel
Planogram strategy shifts significantly depending on where your products are sold. A store layout that works in a grocery aisle will fail in a convenience store cooler.
Here’s how the logic changes across three common retail environments.
Grocery and FMCG
Grocery planograms are built around high traffic and large assortments, shaped by consumer preferences that vary by region.
Eye-level shelves go to high-margin products or promoted items to maximize sales.
Cross-merchandising drives basket size: chips sit near salsa, bread near peanut butter.
Endcaps rotate on a promotional calendar with attractive displays for seasonal products, and planogram resets usually happen quarterly to align with category reviews.
Replenishment frequency is a primary constraint, since high-demand items need enough facings to avoid going out of stock between restocks.
Effective planograms in grocery stores also account for customer flow, placing essentials at the back so shoppers pass higher-margin niche products on the way.
💡 Did you know?
A survey found that 66% of consumers will leave a store and shop elsewhere when an item is out of stock. It’s important to stay vigilant about stockouts, unless you want to lose customers to a different channel, or worse, a different retailer.
Convenience stores
Space is the defining constraint in this retail business. Every facing has to earn its spot.
Vertical product placement and block placement by category (for example, beverages in one column, snacks in the next) help shoppers scan quickly.
The impulse zone near the register features premium products like energy drinks and candy to encourage impulse buying.
Planograms here tend to be simpler but change more often, especially in response to seasonal trends and trade promotions that demand dynamic planograms.
Pharmacy, health, and beauty
Brand blocking within product categories is standard: all of Brand A’s skincare on one shelf section, Brand B on the next.
This supports brand identity and brand recognition, making it easier for shoppers to find their preferred products across multiple shelves.
OTC medication has regulatory placement considerations in some markets. Private-label alternatives are positioned directly adjacent to national brands to encourage trade-up (or trade-down, depending on the retailer’s strategy).
The visual appeal of well-organized health and beauty sections directly affects customer engagement. The reason is that shoppers in this channel tend to browse and compare more than in grocery stores.
💡 Did you know?
In a 2024 Deloitte survey, 59% of US consumers ranked convenient store layouts as a top in-store priority, second only to faster checkouts. How products are arranged on shelves is a core part of that layout experience.
How to build a planogram: In 5 steps
1. Collect your data
Before placing a single product, gather:
- POS sell-through data: What actually sells off the shelf, not what shipped to the store. This is the single most important input
- Category share data: How your brand performs relative to competitors in the category
- Margin data: Gross margin by SKU, so you can prioritize high-profit items in premium positions
- Fixture dimensions: Exact shelf widths, heights, and depths from the retailer. Products that don’t physically fit the shelf get improvised by the store team
- Inventory data: Current stock levels and inventory turnover rates, plus replenishment schedules to align shelf depth with supply
- Shopper traffic patterns: If available, heat maps or foot traffic data showing where shoppers spend time in the aisle
Combining sales data with inventory data and fixture specs gives you a complete picture. Without it, you’re just guessing.
💡 Pro tip:
Compare each SKU’s share of shelf space against its share of category sales. If a product drives 20% of sales but gets 10% of the shelf, it will stock out faster than everything around it.
2. Define objectives and map fixtures
Different goals produce different planograms. Are you optimizing for total revenue, margin contribution, new product introduction, or category growth?
A new product launch, for example, requires eye-level positioning and extra facings to build trial, even if the product has no sales history yet.
Once objectives are set, map the physical fixture. Get exact measurements. A planogram designed for a 4-foot gondola section will not work on a 3-foot shelf, and a field team facing that mismatch will rearrange on the fly.
3. Assign positions and set facings
This is where product placement principles come into play:
- Eye-level positioning for priority items (highest margin, strongest velocity, or promoted products)
- Vertical product placement for brand visibility: stack all of one brand’s products in a vertical column so shoppers can find the brand first, then choose a variant
- Horizontal product placement for category browsing: arrange sub-categories left to right in a logical order (e.g., shampoo, conditioner, styling products)
- Cross-merchandising for basket size: position complementary products near each other to encourage impulse purchases
For facings, use sales volume as the starting point.
For instance, an SKU that sells three times faster than the one next to it needs proportionally more facings to avoid out-of-stock situations between restocks. Factor in package size and replenishment frequency as well.
4. Build, review, and approve
You can use a dedicated planogram software like DotActiv, PlanoHero, and PlanogramBuilder, or create simpler layouts in Excel or PowerPoint. The tool depends on the complexity of your assortment and the number of stores you manage.
Regardless of the tool, the review step is critical. Walk the planogram through category managers and retail partners (if you’re submitting to a retailer), as well as field team leads.
The people who will execute it should see it before it’s finalized.
Customer feedback from previous resets and sell-through results from prior planograms should inform this review.
5. Distribute to field teams and verify execution
The build process is incomplete without a distribution and compliance mechanism. A planogram sitting in a shared drive that nobody checks is a planogram that nobody follows.
This is where retail execution software can help. The right tool lets field reps access planogram specs on their mobile device, capture shelf photos during store visits, and flag compliance issues in real time.
Managers need dashboards to track execution status across all locations, so they can spot problems before they impact sales.
Best practices for building a planogram
1. Start with the fixture, not the product
Get exact shelf dimensions before assigning any SKUs. When the planogram doesn’t match the physical fixture, field teams are forced to rearrange products on the spot.
That improvisation undoes every placement decision you made. Confirm fixture specs with the retail store before building.
2. Use sell-through data, not shipment data
Shipment data tells you what left the warehouse. POS sell-through tells you what customers actually bought off the shelf.
A product with high shipment volume but low sell-through is sitting in a backroom somewhere.
Build your planogram around what sells. This is the foundation of inventory management at the shelf level.
3. Design for replenishment, not just display
A planogram that looks perfect on day one but causes constant out-of-stocks by day three is poorly designed.
Factor in restocking frequency when setting facings.
High-velocity SKUs in stores with infrequent deliveries need more shelf depth or additional facings to avoid empty spots between restocks.
4. Validate with photo audits
The plan is the planogram. The reality is what the shelf actually looks like, sometimes called a realogram.
Planogram compliance refers to the degree of match between these two.
Comparing them is how you measure execution quality across different store locations.
Retail execution software enables reps to capture shelf photos during store visits and compare them against the approved shelf layout.
💡 Pro tip:
Run your first compliance audit 48 to 72 hours after a reset. The biggest shelf drift occurs during the first few restocks, when store teams fall back on old habits.
5. Customize by store cluster
Building a unique planogram for every location is unsustainable.
Instead, group multiple stores by format (e.g., full-size vs. small format) or by region and customer demographics.
Merchandising software makes this process scalable. You can create cluster-level planograms that account for the meaningful differences between store types, without requiring bespoke layouts for each address.
Industry standard is to update these quarterly, with more frequent resets for seasonal and promotional categories. The result is consistent shelf presentation across locations, with enough flexibility to account for local shopping behavior.
Turn your planogram into consistent in-store execution
A planogram is only as good as what actually ends up on the shelf. Stores reset, staff restock on instinct, and within a week, the layout looks nothing like the plan.
A merchandising software like SimplyDepo helps teams catch that drift before it costs them sales. Reps can verify compliance with geo-tagged shelf photos during every store visit, monitor on-shelf availability, and manage tasks and forms directly from the mobile app.
On the other hand, managers can track execution status across all locations from a single dashboard, optimize product demos, and evaluate performance at scale.
The result? Fewer surprises on the shelf and more control over what shoppers actually see.
Book a personalized demo to see SimplyDepo in action!
FAQs
A planogram standardizes product placement so every retail store displays products in the same optimized arrangement. The purpose is to maximize sales and improve product visibility while influencing consumer behavior through strategic positioning. Planograms also make inventory replenishment more predictable. They only deliver results when executed in store, which is why compliance tracking matters as much as the design.
Yes. Planogramming is a recognized retail merchandising skill. A planogram merchandiser or planogram specialist analyzes POS data and studies consumer behavior, then applies category management principles to translate shelf strategy into precise visual layouts. The role sits at the intersection of data analysis and visual merchandising.
It’s a shelf stocking guideline: leave roughly two fingers of vertical space between the top of a product and the bottom of the shelf above. This keeps products visible and easy to grab while preventing wasted vertical space. It helps field teams maintain consistent presentation across multiple locations without measuring every fixture.
Collect POS sell-through data along with category share data and margin data, plus exact fixture dimensions.
Define your objectives, map the physical fixture, then assign product positions using placement principles (eye-level for priority items, vertical blocking for brand visibility).
Set facings based on sales velocity. Build in planogram software, review with stakeholders, then distribute to field teams.
The benefits of planograms cover retail success at every level. They maximize sales through optimal product placement of high margin products and high demand items, while improving inventory management by connecting space allocation to sales data and inventory turnover. They also create a consistent shopping experience across multiple locations. That strengthens brand recognition and drives increased customer satisfaction.
Horizontal product placement arranges items across a single shelf for easy sub-category comparison. Vertical product placement stacks products top-to-bottom across multiple shelves, creating stronger visual appeal and brand recognition.
A visual merchandiser uses vertical for brand-level impact and horizontal for browsing. The right choice depends on customer flow and consumer preferences within the store layout.
Effective retail strategies use dynamic planograms that shift space allocation based on seasonal trends and promotional calendars, adjusted for customer behavior at each location.
Seasonal products move to endcaps and attractive displays to encourage impulse buying, while niche products expand or contract based on regional demand.
Tracking customer feedback and sell-through by location turns each reset into an opportunity to boost sales and refine the customer experience.

-
 October 1, 2026
 -
 October 1, 2026
 -
October 1, 2026
