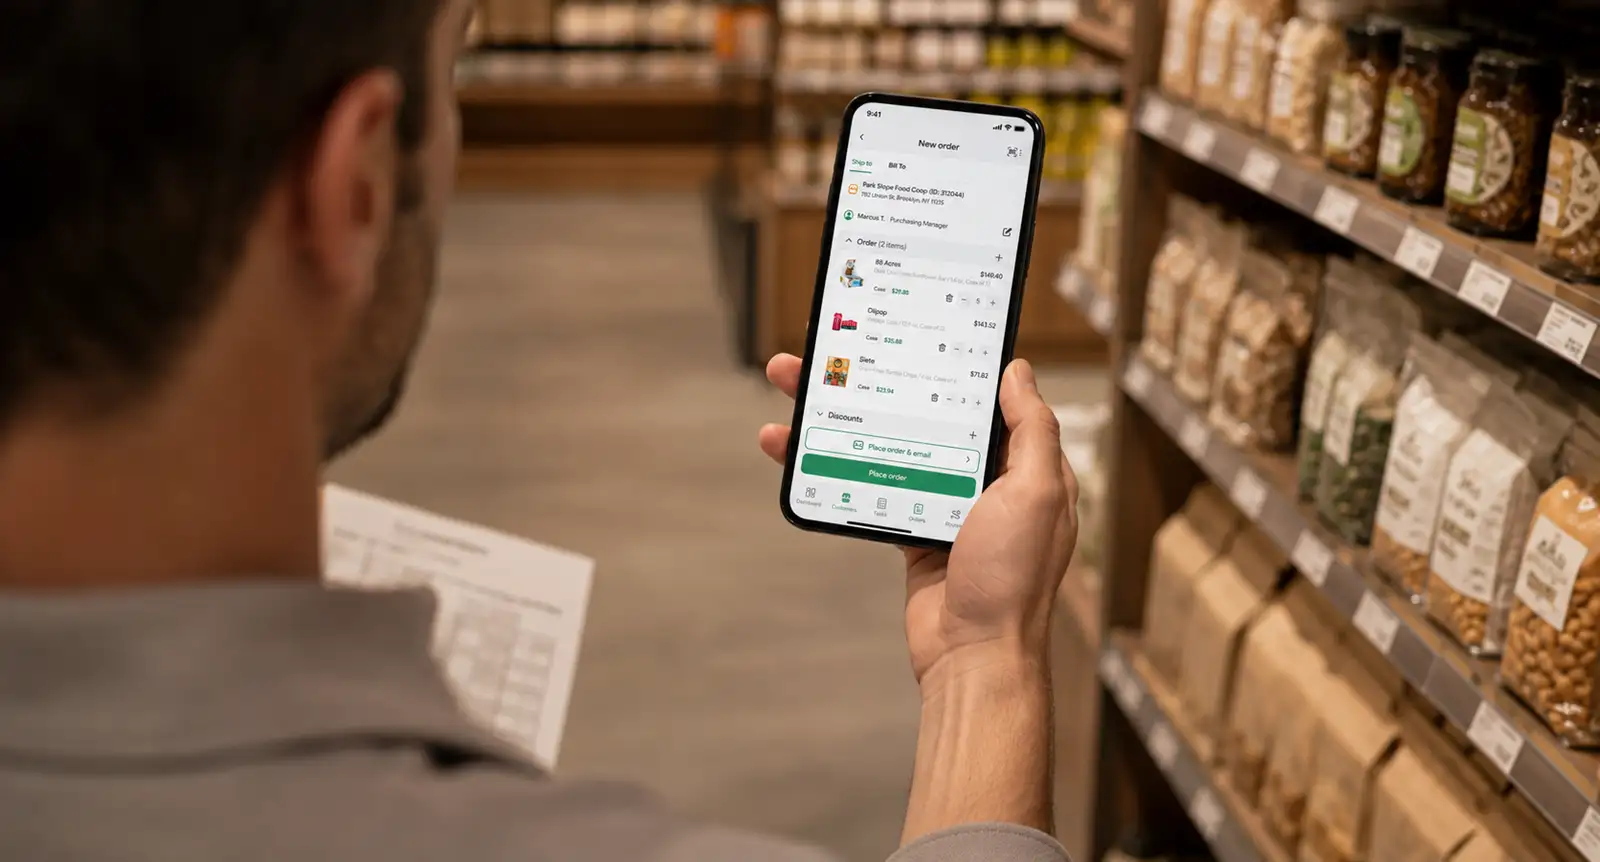
POS Sales: How Point-of-Sale Data Drives Distribution Decisions

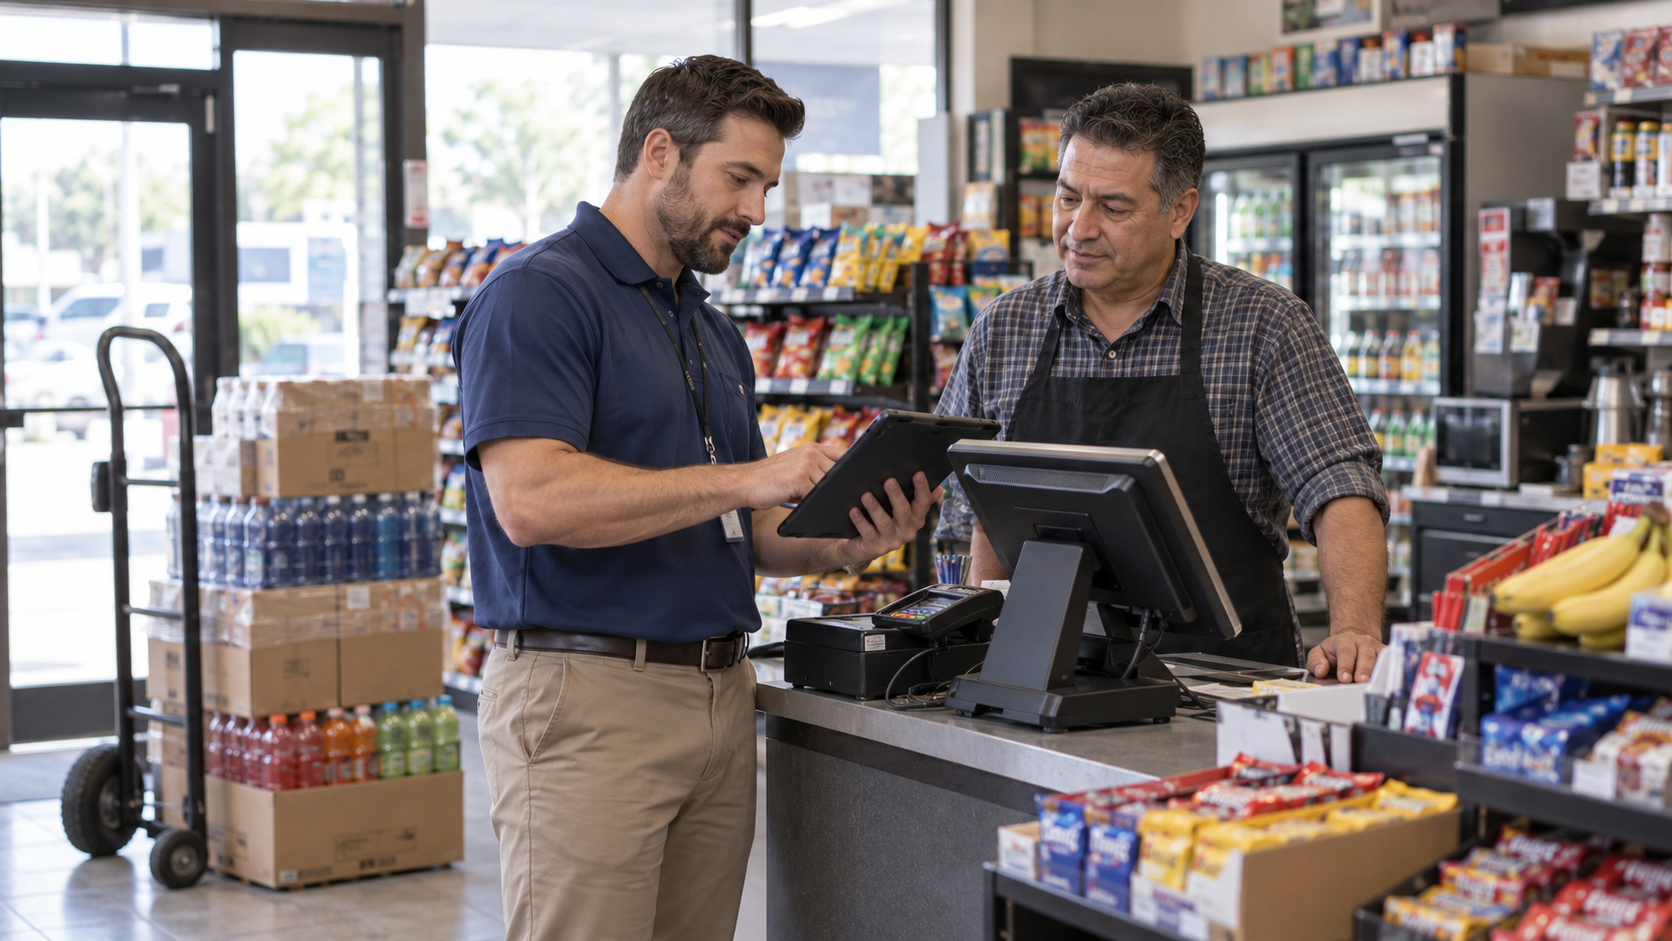
📌 Key takeaways:
- POS data reveals what shoppers buy by SKU, store, and day, giving distributors a clearer demand signal than shipment and reorder history alone.
- When combined with on-hand inventory, POS data improves replenishment quantities, account-level assortments, route frequency, and promotion evaluation.
- Reliable decisions require clean, comparable data and a workflow that turns exceptions into assigned actions for reps and managers.
A distribution business can see only half of its own market. Orders and invoices describe what moved from one company to another, and the record stops at the loading dock.
Everything past that point is inference. Teams estimate sell-through from how soon an account reorders, and a slowing SKU surfaces weeks after the slowdown began.
Point-of-sale data covers the second half. A POS sales feed reports what shoppers bought, by SKU, by store, by day, captured at the retailer’s own terminals.
For a distributor, the value of that record is operational. It sets the quantity on the next truck and the frequency of the next visit, and it does so early enough to be worth acting on.
What does POS data tell a distributor that order history cannot?
Order history records an agreement between you and a buyer. POS data records a purchase between that buyer and a shopper.
The second is the demand signal. The first is a downstream consequence of it, delayed by however long the product sits in a back room.
What sits inside a register feed
A point of sale system finalizes a retail transaction, and POS systems record sales at that moment: the item scanned, the quantity, the price paid, the store, and the timestamp. Receipts follow once payment authorization clears.
Retailers hold those customer transactions in a central database and aggregate them by SKU, store, and day before sharing them with suppliers.
At that resolution you can see velocity store by store, price realization against your list price, and day-of-week patterns. You can also identify the week a SKU stopped moving in one location while holding steady somewhere else.
Why sell-in and sell-through tell different stories
Sell-in is what you shipped into an account. Sell-through is what shoppers bought out of it. The difference between the two is inventory sitting in the channel with your working capital inside it.
When sell-in runs ahead of sell-through for several weeks, you are financing stock that comes back as credits or markdowns. When sell-through outpaces sell-in, the shelf empties faster than you replenish.
What does a modern POS system contain?
Modern POS systems combine hardware and software into one transaction layer that handles sales transactions and the business processes around them.
POS hardware at the checkout counter
POS hardware remains at the checkout counter and handles the physical side of customer transactions. A typical setup pairs a terminal with barcode scanners, credit card readers, receipt printers, and a cash drawer.
Barcode scanners and integrated card readers cut transaction times and reduce manual entry errors, which is also what makes the resulting data usable.
Mobile POS runs the same workflow on tablets or smartphones. Those POS devices suit pop-ups, market stalls, and staff who accept payments away from a fixed counter.
POS software and where the data lives
POS software handles pricing, discounts, sales tax, and the logic behind each sale. It automates the math and the logs that staff once kept by hand.
Many POS systems extend well past checkout into inventory management, employee management for tracking hours, and customer relationship management. Sales reports and analytics are standard in most POS systems, and the depth of that reporting layer decides how much store-level detail a supplier can ever receive.
Integration with accounting software closes the loop on financial reporting.
Which type of POS system produces the most useful data?
POS companies build for different operating conditions. The architecture a retailer chooses determines how quickly you can see their numbers.
| System type | Where data lives | Internet connection | Strengths | Best fit |
|---|---|---|---|---|
| Traditional POS | Local servers on site | Works offline | Greater control over data security, no reliance on connectivity | Single-site retail stores, legacy system estates |
| Cloud-based POS | Stored online, reachable remotely | Reliable connection required | Remote access, lower upfront cost, faster reporting to suppliers | Retail business with multiple locations |
| Mobile POS | Usually cloud based | Reliable connection required | Runs on mobile devices, fast to deploy | Markets, events, in-person transactions off the floor |
| Multichannel POS | Cloud based systems with channel connectors | Reliable connection required | Manages sales across multiple channels | Retailers combining stores with online ordering |
| Specialized POS | Varies by vendor | Varies | Built for one sector, such as restaurant POS and hospitality | Food service, salons, hospitality |
Cloud or on-premise?
A traditional POS runs on local servers and keeps store data in the building. Cloud based POS systems store data online, which lets a head office pull numbers from multiple terminals across multiple locations without visiting any of them.
Cloud based POS software generally carries lower startup costs and shifts the expense into a software subscription. The tradeoff is dependence on an internet connection to function.
Which distribution decisions should POS data drive?
A data feed earns its keep when a named person changes a named decision because of it. The following decisions respond to POS signals faster than the rest.
1. Order quantity and replenishment timing
Store-level sales combined with on-hand inventory produce days of supply per SKU per store. That figure should set the quantity on the next truck.
An account running below a week of supply needs an earlier stop. On the other hand, an account sitting on 40 days needs a smaller drop and a conversation about facings.
2. Assortment per account
Velocity varies enormously between stores that look identical on a customer list. POS data lets you pull a slow SKU from the 30 accounts where it moves twice a month and push it into the 10 where it moves daily.
Half the consumer products executives surveyed for Deloitte’s 2026 Consumer Products Industry Global Outlook plan to rationalize their SKU counts. Store-level velocity is the evidence that decides which items survive that cut.
Pro tip: Before removing a slow-selling SKU, check how often it was actually available. Low sales caused by repeated stockouts point to a replenishment problem, not weak demand. Compare velocity only across in-stock periods so unavailable products are not incorrectly marked for delisting.
3. Route frequency and coverage
Visit frequency usually dates back to whoever built the sales territory years ago. Weekly velocity per account is a cleaner basis for it, since high-turn accounts justify more stops and slow accounts can shift to a bi-weekly cadence.
Reallocating stops this way changes route accounting economics directly, because every stop carries a fixed cost regardless of the order written there.
A decision-by-decision view
| Decision | POS signal to watch | Useful refresh rate | Who acts on it | Cost of acting late |
|---|---|---|---|---|
| Replenishment quantity | Days of supply per SKU per store | Daily to weekly | Rep or route planner | Returns, spoilage on short-code items |
| Assortment per account | Units per store per week vs cluster median | Monthly | Territory sales manager | Shelf space reassigned to a rival brand |
| Route frequency | Velocity and order value per stop | Quarterly | Route planner | Cost to serve climbs, rep hours wasted |
| Promotion evaluation | Lift against pre-promotion baseline, by store | Weekly during the promotion | Trade marketing | Trade budget renewed on a promotion that failed at shelf |
| New item launch | Rate of sale in the first 8 weeks | Weekly | Brand and sales lead | Delisting at the next line review |
Where does POS data come from when retailers will not share it?
Large chains run supplier portals. But independent accounts, which carry a large share of direct store delivery volume, rarely publish anything at all.
Retailer portals and syndicated feeds
Chain portals deliver store-level sales and sometimes on-hand inventory, usually on a daily or weekly cycle. Syndicated panels cover broader market share but arrive later and at coarser granularity.
Access is uneven, and both sides know it. In the same Deloitte research we discussed before, 64% of retailers believed they shared sufficient data with suppliers while only 40% of consumer products companies agreed they received enough.
Field-captured proxies
When no feed exists, your reps are the register. Shelf counts, back-stock checks, facing counts, and dated photos recreate a usable rate of sale per account.
Reorder interval is the simplest proxy of all. An account that reordered every 10 days and now reorders every 24 has told you its sell-through halved, with no retailer cooperation required.
Have reps log whether the SKU was on the shelf during that same visit. One store walk then answers two questions: how fast the account sells the product, and whether shoppers could find it at all. Tracking both is a core part of DSD best practices.
How do you reconcile POS sales against your own shipment records?
Reconciliation is where POS data turns from a report into a decision. Running it weekly separates teams who act from teams who observe.
Build a sell-in to sell-through bridge
Start with opening store inventory, add units shipped in the period, subtract POS units sold, and compare the result against reported on-hand. A clean match confirms both data sets.
A persistent difference points to something specific: unrecorded returns, employee theft, damaged stock written off in the back room, or product moved to another location in the chain.
Watch for phantom inventory
Phantom inventory is stock a retailer’s system believes is on the shelf when the shelf is empty. It suppresses automatic replenishment, so sales flatline while the inventory system reports healthy coverage.
POS units dropping to zero while reported on-hand stays positive is the classic signature. That pattern belongs on a rep’s task list within days.
What distorts POS data, and how do you correct it?
A POS file is a record of what a retailer’s system captured, which is close to consumer demand without being identical to it.
Reporting lag and shifting store counts
Feeds arrive on different schedules, from next-day to 3 weeks. Compare a fresh chain feed against a lagging one and the slow retailer looks like it is losing share when it is only reporting late.
Store counts move too. A chain that closes 4 locations mid-quarter shows falling total units while rate of sale per store holds steady, so track units per selling store and not the chain total.
Unit definitions and promotional noise
One retailer reports units, another reports cases, and a third counts distribution center withdrawals as consumer sales.
Normalize everything to a single unit of measure before anyone builds a chart, since a withdrawal figure describes the retailer’s own internal movement.
Promotions distort in both directions. A price cut lifts units and depresses the weeks that follow, so hold a baseline of non-promoted weeks for each SKU and read every lift against it.
How do you turn POS signals into a weekly operating rhythm?
Dashboards fail when nobody has agreed in advance what a number should trigger. The fix is procedural.
Set thresholds before you open the file
Decide the trigger points first, such as: days of supply below 7, velocity down more than 20% against a 4-week average, zero sales for 2 consecutive weeks in an account with positive on-hand.
Thresholds set in advance stop the weekly review from turning into a debate about whether a decline is real.
Give every exception an owner
Each triggered threshold should generate a task assigned to a person with a date.
McKinsey’s work on AI in distribution operations points to inventory reductions of 20% to 30% and logistics cost reductions of 5% to 20% where planning is rebuilt around better demand signals. The prerequisite is a named owner and a date on every exception.
Which metrics belong on a distribution POS dashboard?
- Sell-through rate by account: Units sold divided by units received, on a rolling basis
- On-shelf availability: The share of audited visits where the SKU was present and faced
- Velocity per point of distribution: Average units per store per week
- Days of supply: On-hand divided by average daily sales, per SKU per store
- Distribution voids: Accounts in a chain carrying the brand but missing a specific SKU
- Promotion lift: Promoted weeks measured against the stored non-promoted baseline
Several of these overlap with the broader set of retail KPIs field teams already review.
Turn POS data into action on every route
POS data shows what sold. Distribution management software helps teams act on those signals by connecting customer records, order history, inventory, and route plans.
A platform like SimplyDepo gives reps live stock visibility, account-specific pricing, route guidance, and offline order capture in one mobile app.
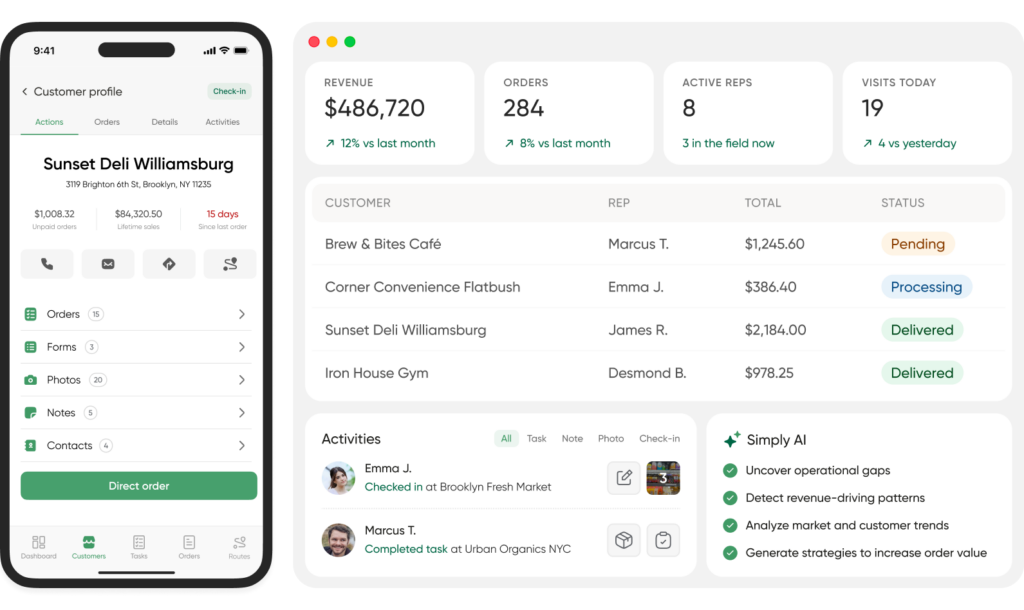
With SimplyDepo, reps can also log shelf audits, photos, and proof of delivery during store visits. Managers track performance through real-time dashboards, while QuickBooks Online sync keeps orders and invoices aligned.
The result is faster replenishment, cleaner inputs for inventory forecasting, and better decisions at each account.
Book a free demo to see how SimplyDepo can support your distribution team.
FAQs on POS sales
A POS system captures a sale at the terminal, applies pricing and tax rules, routes the payment for authorization, issues a receipt, and writes the transaction to a database. That record updates inventory counts and feeds sales reports.
A traditional POS runs on local servers at the site, which gives greater control over data security. Cloud based systems store data online for remote access across multiple locations and depend on a reliable internet connection.
Hardware, the software subscription, and payment processing costs. Cloud based POS software typically carries a lower upfront cost than a server-based setup, and add-ons such as loyalty programs are priced separately.
Yes. Each scanned sale decrements the inventory system immediately, which is what makes real-time stock counts possible. Accuracy still depends on disciplined receiving, since a POS cannot see stock that was never booked in.
POS data measures consumer purchases at the register, while sell-in measures what you shipped into the account. Planning against sell-in alone hides inventory sitting in back rooms and produces orders that outrun real demand.
Rarely. Customer loyalty programs and the customer information behind them belong to the retailer, and access is usually reserved for large brands with a formal data partnership. When a retailer does share it, loyalty data exposes customer preferences such as repeat rate and purchase interval, and basket counts show how many separate shopping trips included your product. Units and on-hand by store are the more realistic ask.
No. POS data improves the inputs a forecast runs on by grounding it in consumer purchases at store level. Forecasting models still handle seasonality, promotional baselines, and lead times.
-
 October 20, 2026
 -
 October 20, 2026
 -
 October 20, 2026